
The Capital Rotation Is Beginning
Evidence after evidence.


This is not financial advice and you should always do your own due diligence.
Errors may occur.
Content; 3,650 words 23,448 characters, 15 data/charts, 18 minute podcast & 10 minute podcast for free subscribers.

We are observing clear evidence of this phenomenon across the financial markets.
In this letter, we will focus on Asset vs. Asset analysis. But also we are going to take a look at Corporalis Commodis Index, NDX insider buying, Energy insider buy/sell ratio, investor cash allocations, retail buying, leverage usage and hedge funds dumping Mag 7 stocks long before any negativity was evident in mainstream media. Furthermore, by pricing assets relative to one another, we gain insights into how they move in relation to each other — essentially identifying outperformance trends while rotation is a lagging effect of this particular dynamic. Additionally, ratio analysis helps assess relative valuation, providing clues about whether an asset is relatively cheap or expensive. However, the primary signal we focus on is rotation trigger points. As I was taught by financial players that are at the top specter of the financial world.
I have personally been aware of an incoming rotation since 2018 and began publicly discussing it between 2020 and 2021. Interestingly, we lacked clear structural evidence of asset movements confirming this rotation at the time, but we now see undeniable signs of it taking place. Where gold is the ultimate proxy for cycles, as there is hundreds of variables relative to investor psychology within the asset GOLD and why Smart Money can not get enough of Gold.
A comprehensive 18-minute podcast summarizing the key insights from this letter will be available at the end of the letter. This podcast is designed to make it easier to absorb the in-depth analysis and heavy content/dense material CC provides — in a more accessible and convenient way for investors. There will also be an 10-minute podcast for free subscribers covering the open content.
Note: You can play the podcast and continue using your phone, or even lock your screen, without interruption. Big thanks to Hellhammer from InvestorPrat for putting CC on the path for this particular idea enhancing content for readers to the next level.
“One asset after another is losing ground to Gold, underscoring the broader macroeconomic transition taking place.”
- Corporalis Commodis
We are witnessing a wave of key assets breaking out relative to their counterparts, marking the early stages of a potential shift in market leadership. This dynamic reflects the relative strength of certain asset classes over others, providing valuable insights into which sectors and instruments are gaining momentum.
- Corporalis Commodis
First, welcome to the Corporalis Commodis Index.
As of mid February 2025, I have started to disclose to my readers my equity holdings and which stocks I am targeting. We are talking companies and sectors beyond little Shelf Drilling and how I am re-building the current portfolio.
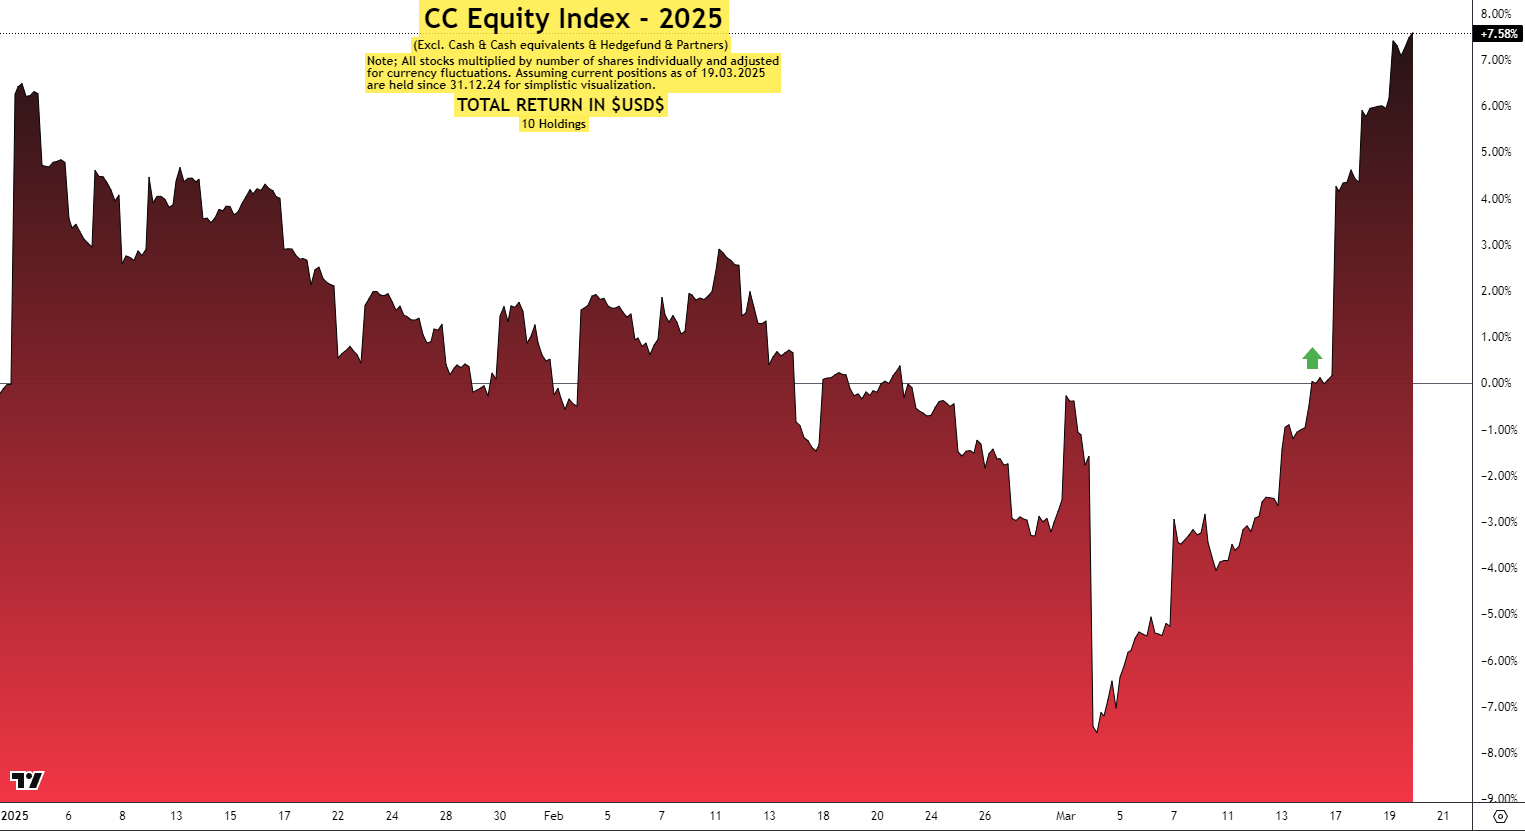
This is the Corporalis Commodis Index. While this index do not accurately display my actual profits, as the index is correctly weighted but it does not account for when I bought or sold shares — the index only takes in to account that current holdings as of 19.03.2025 are held since 31.12.2024.
CC Index has experienced a rapid upward movement in recent sessions, and now stands at +7.58% year-to-date (YTD) following today's market close. SHLF’s & general market volatility has been effectively managed, outperforming both the NASDAQ and S&P 500, positioning the index in a decent profit for the year — despite the fact this might turn tomorrow.
Prior to this development, I shared an update in the CC Discord, highlighting the index's recovery as it approached the breakeven point. Since then, the momentum has continued to build, reflecting a strong balanced hedge.
CC Index versus SP500 & NASDAQ
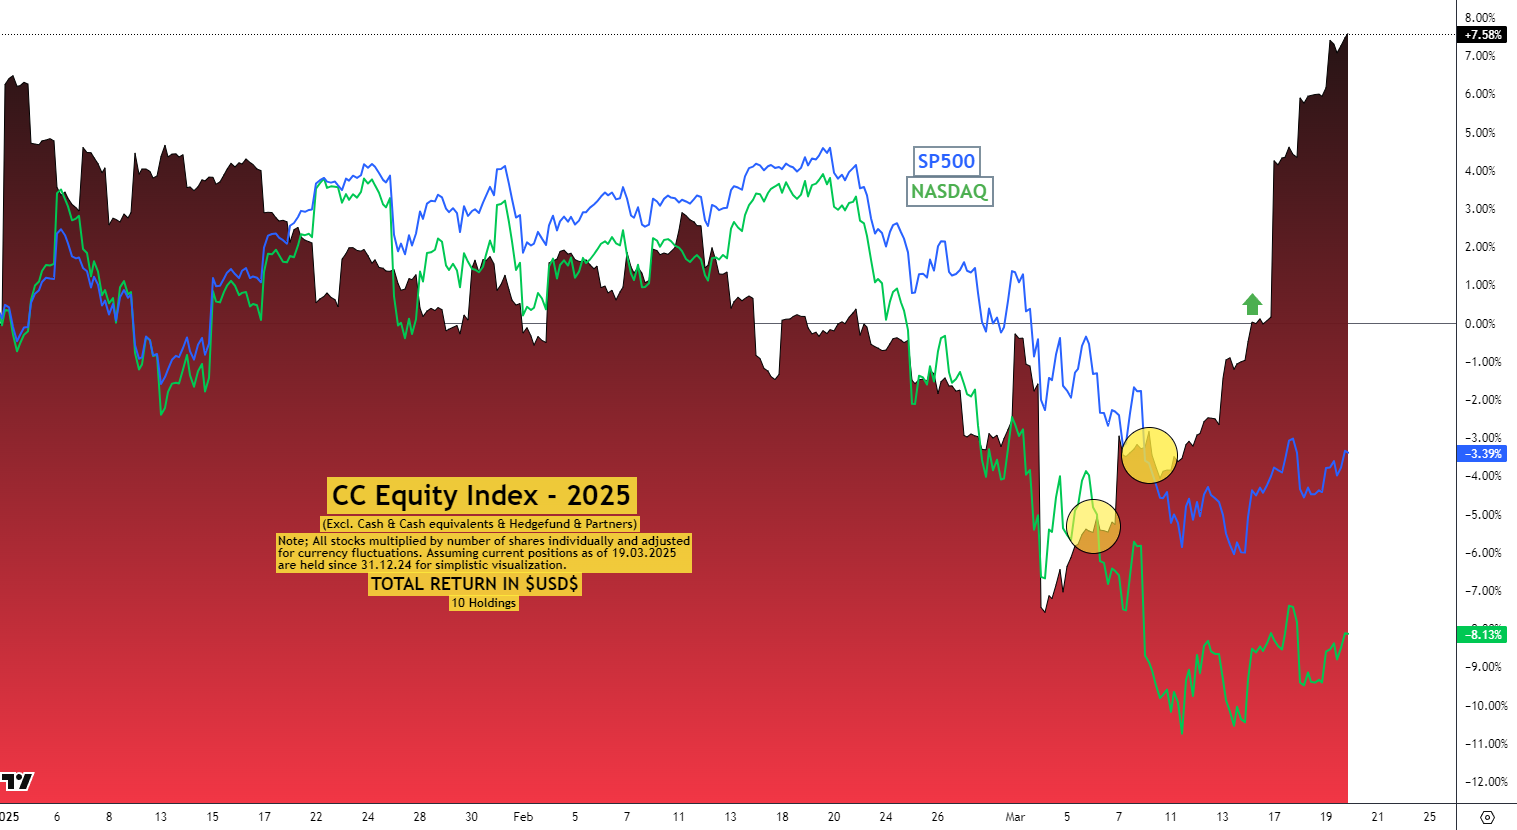
Tells the tale.
Moving on to the main essence of the letter;
Lets take a look at investors cash allocation, insider buys and leverage usage.
SP 500 VS CASH ALLOCATION
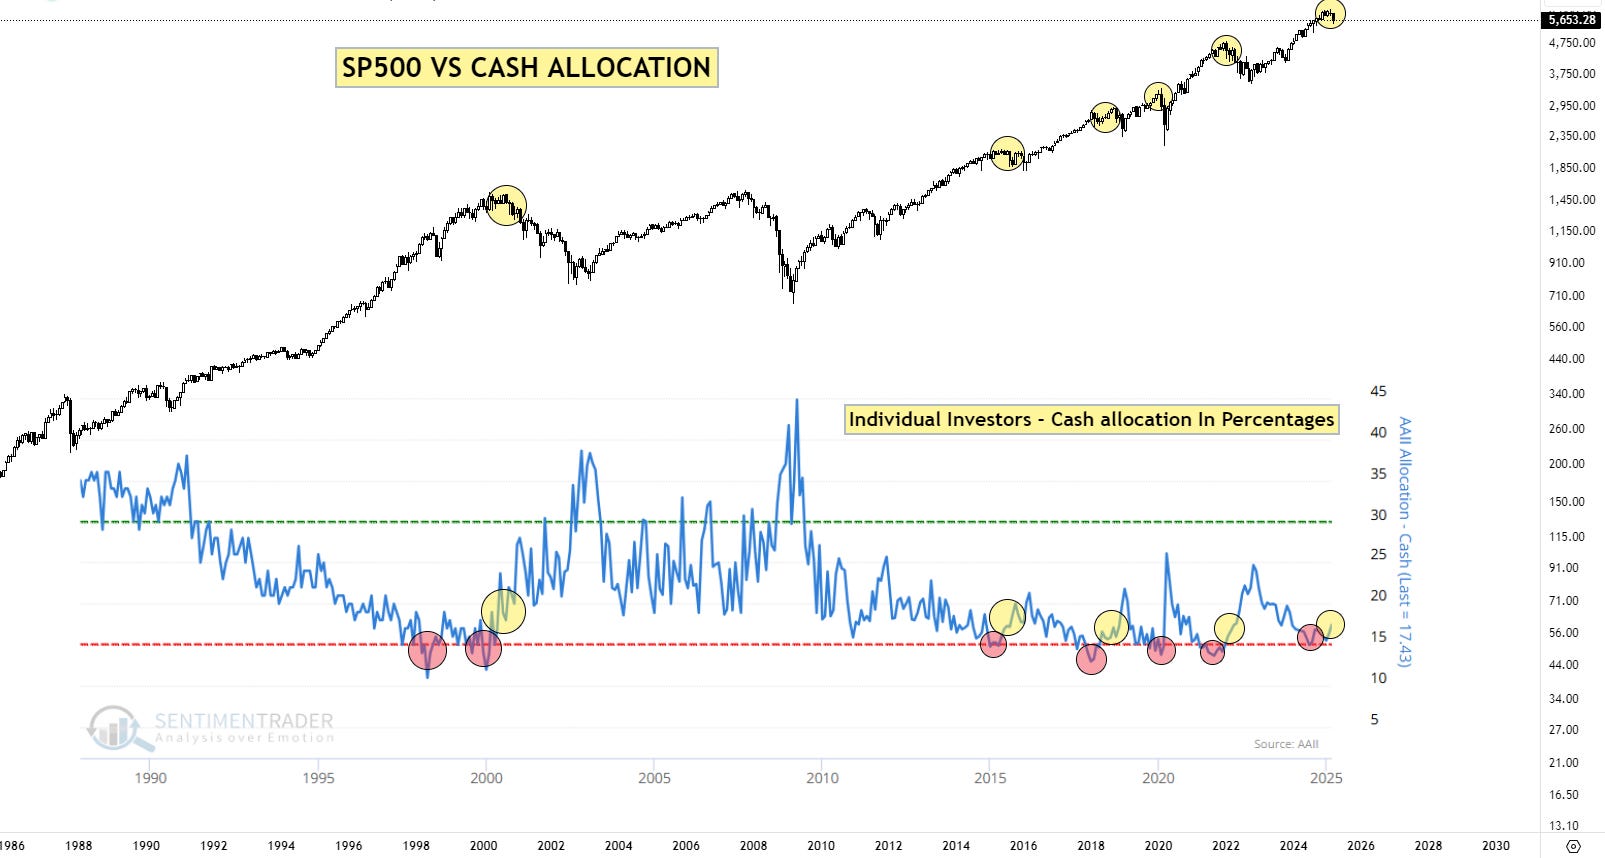
Each time investors reduce their cash allocations to around 15%, we begin to approach what can be considered a "maxed-out" positioning. With investors fully deployed, there is limited liquidity left to further drive the markets. This phenomenon occurs in intermediate cycles, mid-term pauses, and during major paradigm shifts when transitioning from one market cycle to another.
Currently, we are witnessing an extended period of historically low cash allocations, averaging just under 20% over the past decade. Historically speaking this is extremely low. This trend reflects the extraordinary bull market of the ongoing cycle, supported by QE, excessive money printing and speculation which is now reaching its conclusion. A long-term moving average analysis of cash allocations further highlights that investors have not maintained such low cash levels for such an extended period.
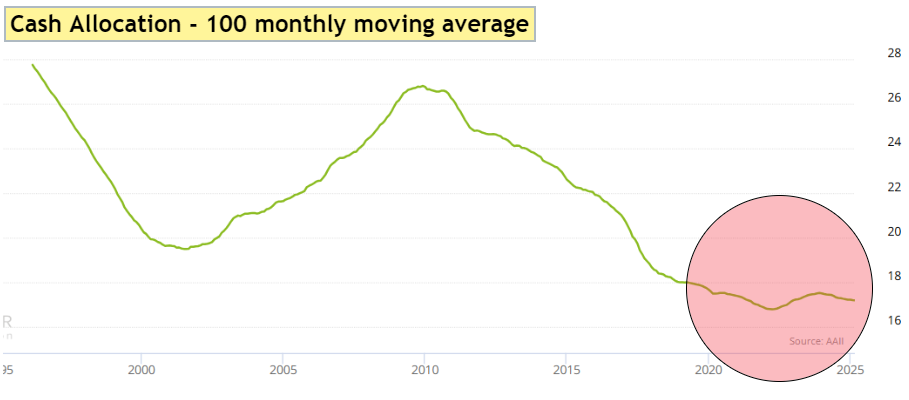
Even beating the 2000s run.
Referring back to the first chart, I have plotted the S&P 500 against AAII Cash Allocations, which represent individual investor cash holdings. In the chart, I have highlighted the 15% threshold with a red circle. However, meaningful action does not begin until cash allocations start to increase, indicating actual liquidation — this is marked with a yellow circle.
Once again, investors have reduced their cash allocations to 15%, a trend I previously highlighted in the CC Discord. However, we are now seeing a slight uptick in cash allocations, coinciding with the stock market’s decline over the past month. These data points align with the positioning insights I shared yesterday from Deutsche Bank and Goldman Sachs, further reinforcing the broader market shift.
Corporate Insider Buys — NDX 100
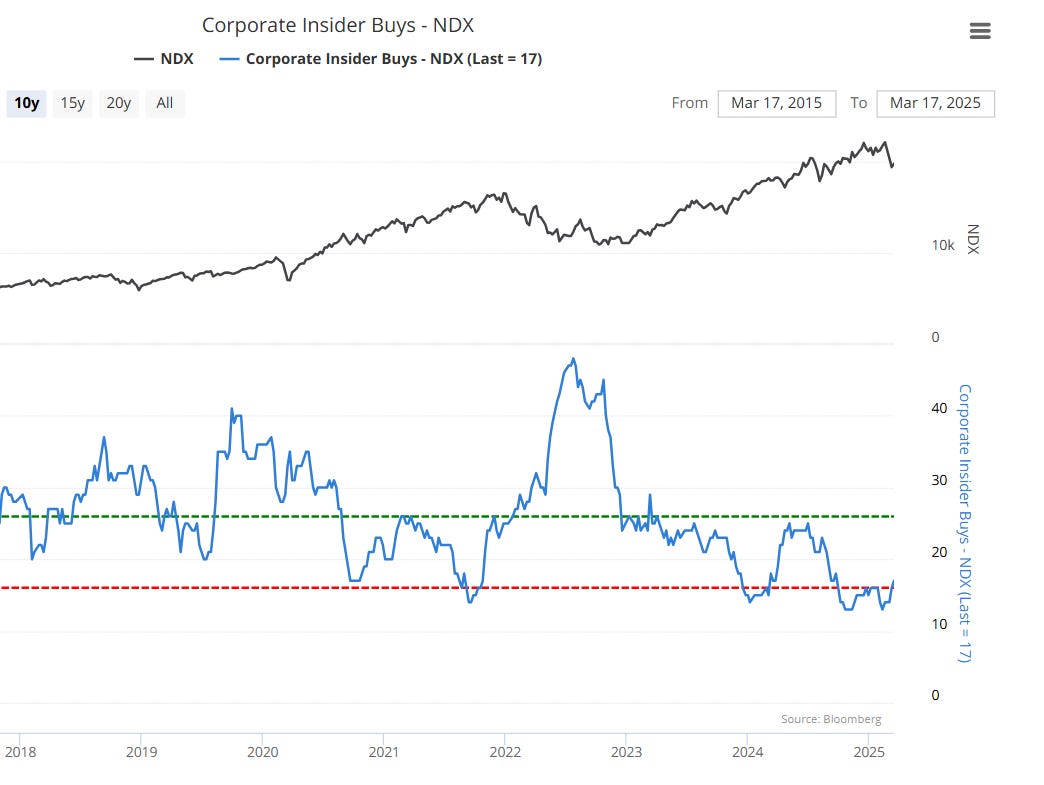
We have now reached a critical juncture where insiders in mega-cap stocks are refraining from buying, a notable divergence from broader market behavior. This lack of insider accumulation is particularly telling, as corporate executives and institutional leaders typically have a deeper understanding of their respective company’s and future prospects.
Ironically — but not unexpectedly for CC readers — this stands in stark contrast to retail investors, who often exhibit the opposite behavior. Historically, such disparities between insider actions and retail sentiment have served as key contrarian indicators, signaling potential turning points in market cycles.
The reluctance of insiders to buy at current levels may suggest overvaluation, weakening fundamentals, or an impending larger shift in market dynamics, reinforcing the broader theme of capital rotation away from growth orientated leadership. This trend further aligns with the structural shifts we will analyze across various asset ratios, adding yet another layer of evidence to the evolving market landscape.
Retail Buys NDX 100 — Goldman Sachs
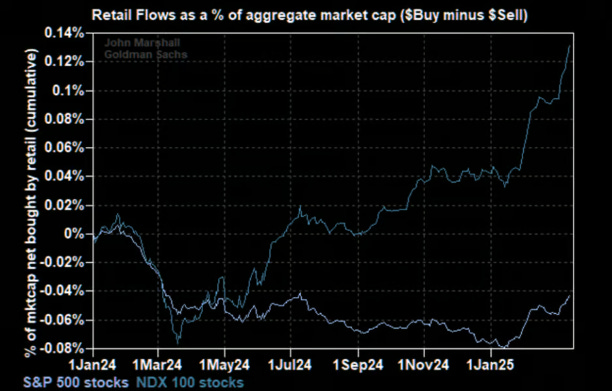
Retail can’t stop and won’t stop. A much larger scare is needed. Seemingly, retail can not get enough of NDX stocks, while the insiders in their respective companies do not share the same optimism.
SP500 Energy Insider Buy/Sell Ratio
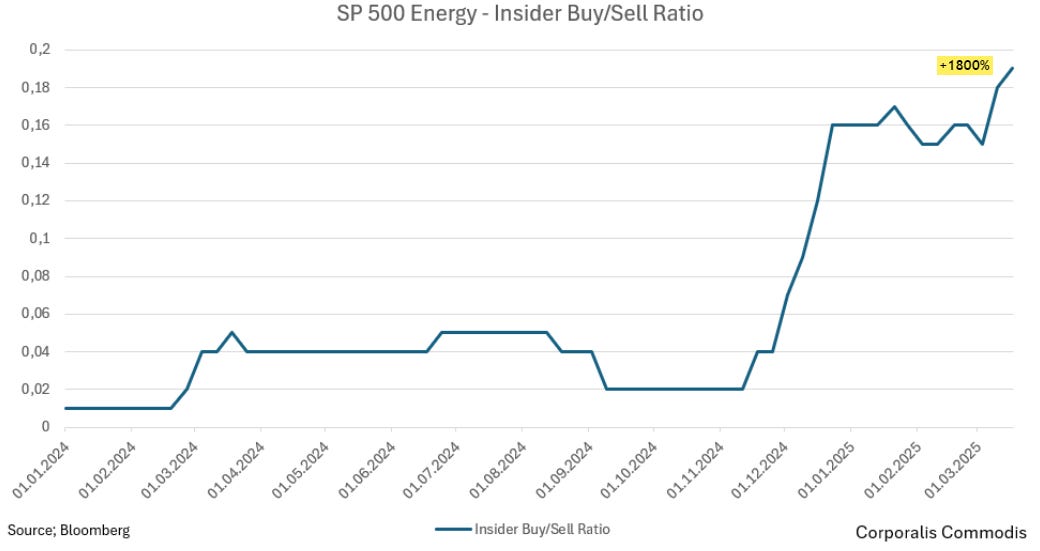
SP500 Energy buy/sell ratio has increased rapidly as of late. The ratio was standing at a decade low of 0,01 at the beginning of 2024, and now currently in March 2025 standing at 0,19, the ratio is then effectively up 1800 %. Mainly driven by sales collapsing in to November 2024 which kick started this ratio, then the buys started to step up right after which has driven this ratio up 1800% from the lows seen at the start of 2024. Fascinating look is it not. Energy insiders going the opposite way.
Leverage Usage — ETF Leveraged Long/Short Spread
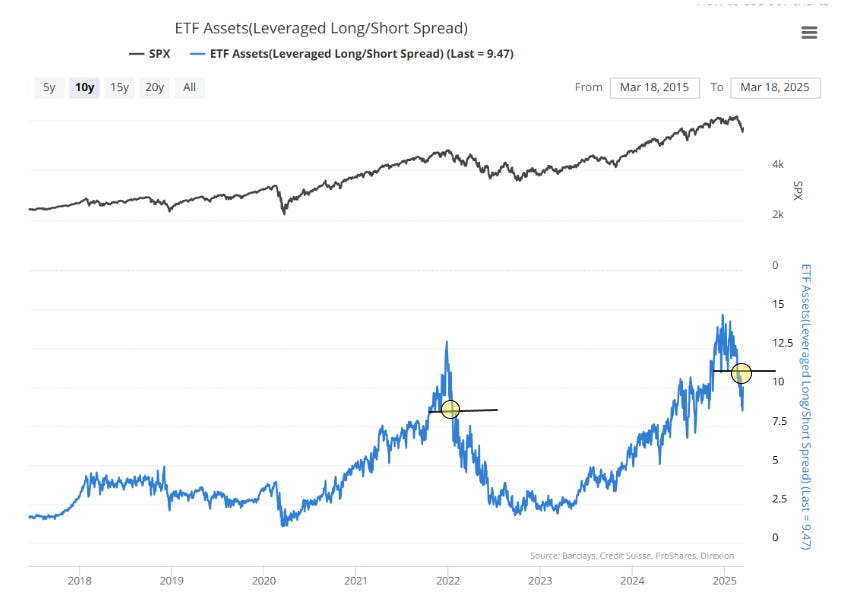
As previously covered in CC Discord, we have been monitoring the use of leverage in financial markets, a critical indicator of investor sentiment and risk appetite. Over recent years, leverage usage has surged to historically extreme levels, reflecting the hallmarks of mania stages — periods characterized by excessive speculation, aggressive leverage usage, and heightened market exuberance.
However, we are now witnessing a rapid unwinding of leveraged positions, signaling a significant shift in market behavior. Investors are actively de-leveraging at an accelerated pace, a phenomenon that closely mirrors the conditions observed in the second half of 2021 (H2 2021). During that period, the market transitioned from peak speculation to a phase of risk reduction, leading to sharp volatility spikes and broader asset rotation.
This ongoing de-leveraging phase suggests that market participants are increasingly moving toward risk aversion, in response to financial conditions, macroeconomic uncertainty, and shifting capital flows. Historically, such trends have preceded broader market corrections or structural realignments, as excessive leverage is often a key driver of both parabolic upswings and subsequent market drawdowns.
It will be crucial to assess the velocity and depth of the de-leveraging process. A prolonged reduction in leverage could indicate a more fundamental shift in market structure. Regardless, the current dynamics reinforce the importance of monitoring liquidity, leverage, and investor positioning as leading indicators of broader market movements.
But this is now, as displayed for readers in CC Discord — we have monitored institutional positioning for example in the Magnificent 7 stocks. They started aggressively dumping Summer 2024, and have not stopped since. 8 months before negativity was evident in mainstream media.
Hedgefund Clients of Goldman Sachs
Magnificent 7 Positioning
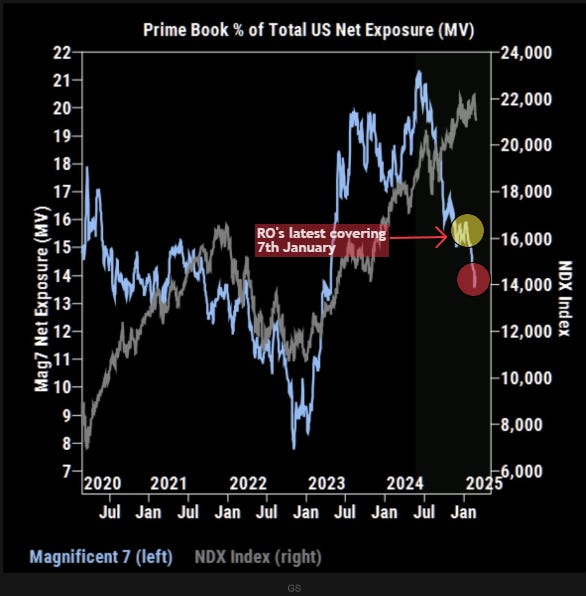
Data from 25.02.2025
Hedge funds were among the earliest to establish positions in Magnificent 7 stocks (Apple, Microsoft, Alphabet, Amazon, Nvidia, Meta, Tesla — and equally swift in unwinding them, well ahead of the broader market. At the midst when the broader investor base piled in, hedge funds had already started to dump on them, strategically reducing exposure ahead of the volatile drawdowns that would come later in 2025.
This represents a rapid de-risking of "prime stocks," a trend that we suspected several quarters in advance. As anticipated, institutional investors have been offloading these positions into the ongoing market rally, effectively passing risk onto latecomers chasing momentum.
In hindsight, this sequence of events unfolded as suspected — reinforcing the importance of tracking institutional positioning and risk management strategies, which often serve as leading indicators of broader market movements.
Thank you for reading.
Podcast for free subscribers.
Premium subscribers can look past this podcast as the 18-minute podcast for the full content will be attached at the end of the letter.
Note: You can play the podcast and continue using your phone, or even lock your screen, without interruption.
Disclaimer: This podcast is AI-generated, and there may be potential discrepancies or inaccuracies in relation to the original letter and general factual aspects. While it aims to summarize the content effectively, it may not fully capture every detail or main themes with absolute precision.
Now to the main treat of this letter, which is Asset versus Assets, and the impeccable evidence for the new cycle that is emerging and the capital rotation that finds it self in the very early innings of a larger structural condition. Only for premium subscribers. Consider a 7-day free trial today, and gain access to the full archive, can cancel at any time. To access CC Discord and all the content & inputs ranging from the full economy to the financial markets you have to move to a paid subscription. I have begun to share much more on CC Discord ranging from everything finance and economy related, slightly taking the spotlight away from Substack letters.
Keep reading with a 7-day free trial
Subscribe to Corporalis Commodis to keep reading this post and get 7 days of free access to the full post archives.