
Systemic selling is here
Liquidity is the foundation beneath markets. It dictates capital flows, sets the boundaries for risk-taking, and ultimately overrides both biases and fundamentals. Capital flows are taking control.

Three weeks ago, CC informed its readers that short positions had been established as a hedge against rising risks in debt and equity markets. A play on capital flows to hijack investor’s favored assets. Indeed, if capital flows turn excessively negative, it is important to recognize that no instrument is immune.
There are moments in markets where price action appears fragmented, disconnected, and at times even contradictory. War breaks out and gold corrects deeply, yet remains structurally firm. Silver weakens while its premium strengthens elsewhere. Equities begin to roll over while yields push higher. To the untrained eye, these may appear as isolated developments. They are not. What we are witnessing is the early stage of a broader dynamic driven by one dominant force: liquidity.
Liquidity is the foundation beneath all markets. It dictates capital flows, sets the boundaries for risk-taking, and ultimately overrides both biases and fundamentals. When liquidity is abundant, markets can sustain divergences, excess, and mispricing for extended periods. But when liquidity begins to tighten, those same markets are forced into alignment, often abruptly and without warning. This is where most investors may misinterpret what is happening. They analyze assets in isolation, searching for asset-specific explanations, while the true driver can often sit at a higher level. In a full force liquidation event, or gradual but persistant liquidity problems, one should not expect any asset to be immune. Capital does not move randomly. It responds to constraints, incentives, and pressure. And when those pressures build, price action begins to reflect something larger than the individual asset itself. The developments across silver, gold, equities, and bonds are not separate stories but rather interconnected expressions of tightening liquidity.
Silver premiums
First I have a digression in relation to silver. As of 30 March, the divergence between silver prices in New York and Shanghai is becoming increasingly pronounced and even appears to be developing into a trend. The nominal price series shown in the top panel is based on daily closing prices and does not reflect intraday highs or lows. As a result, the low recorded on 6 February does not represent the absolute low for that session. While the chart suggests lower lows in closing terms, one could argue that the true price lows were comparable.
Nonetheless, because the series is based solely on closing prices, it still illustrates a pattern of declining lows in nominal terms. In contrast, the Shanghai premium over New York, shown in both dollar and percentage terms, exhibits a different dynamic. Here, the lows are gradually rising, forming higher lows rather than lower ones.
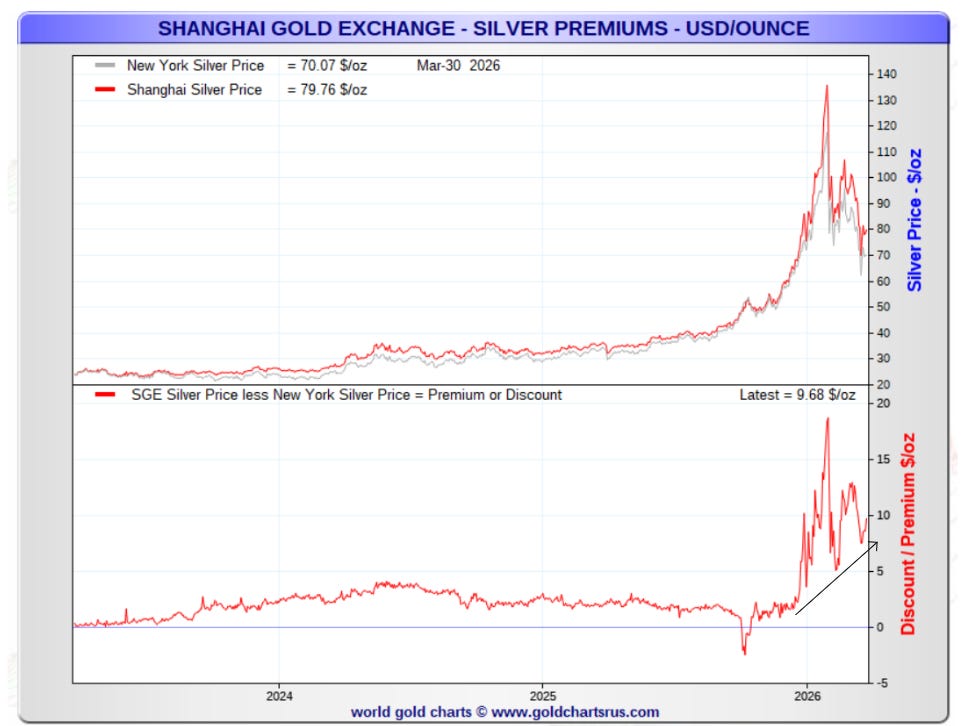
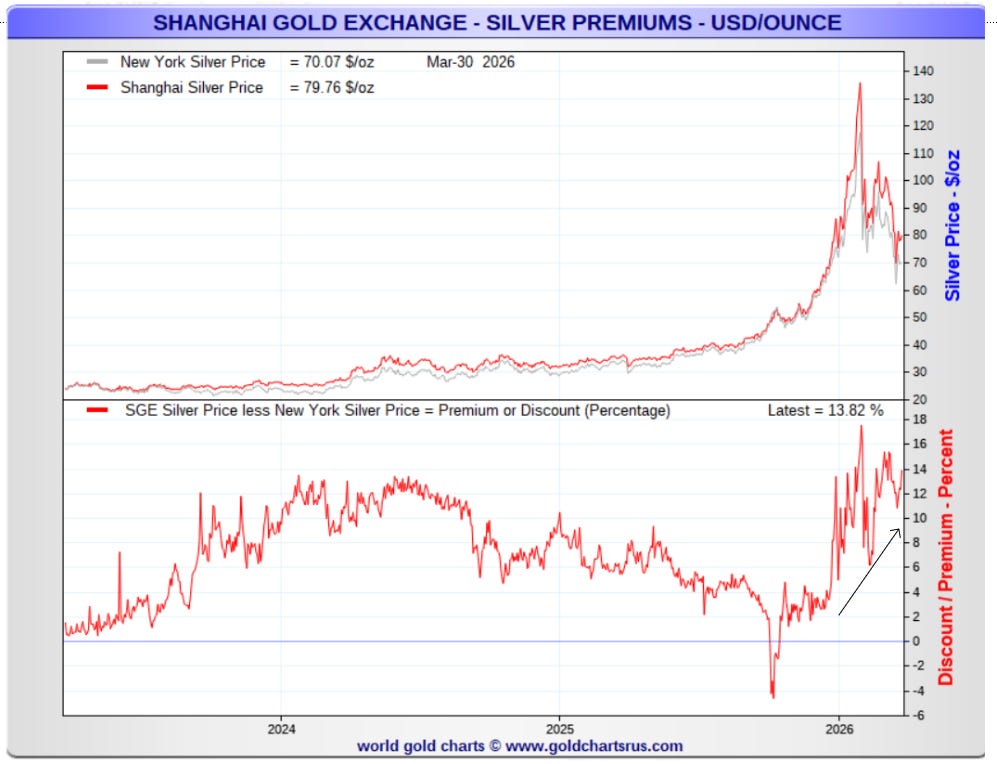
This divergence indicates two key developments. First, a significant dislocation is emerging between paper and physical markets, with Shanghai as the proxy for the physical market. Second, it indicates the underlying weakness appears to be primarily originating from the New York market, which further reinforce the liquidity strains we are currently observing in the US/EU.
At the same time, the Shanghai premium is strengthening, suggesting that the spread is attempting to break higher relative to Western pricing. The consistent formation of higher lows in the premium signals building upward pressure as it approaches previous highs.
Burn the silver papers
What has been unfolding at COMEX since late January reflects a significant reduction in paper positioning, with participants exiting synthetic claims at a notable pace. OI has declined from 160k contracts to 115k contracts over the last two months. Put simply, they are getting out of paper claims before the absolute demise of the paper-system forces these contracts to its correct value: zero. Impressive how long they have fooled billions of people with buying and selling stuff they essentially do not have. What we have witnessed in the commodity markets is a tease, and the inflection point is now on our doorstep. A world to come that will not be recognized, in terms of markets and pricing.
Meanwhile, commercial players, particularly producers and miners, are showing a clear divergence in positioning, increasingly tilting toward a net-long stance. In October, they were net short approximately 70,000 contracts, compared to around 40,000 net short as of March 2026. If anything, commercial players are more bullish today than they were at any point in 2025, by either almost doubling long exposure or by cutting short exposure in half. This contrast highlights a growing disconnect between speculative positioning and commercial behavior, suggesting that those closest to the underlying market are positioning for a different outcome than what is implied by the broader paper-driven activity. But if you do not understand the underlying paper system, how can you understand a product priced in this very paper system? Understanding the asset, will do you no good in understanding the product. An important nuance most investors struggle to differ.
What was once considered a functional market has already devolved into a playground driven by artificial supply and price distortion. The only question is how quickly this is recognized. The instruments, products, and price quotes being observed are ultimately derived from the very system responsible for the distortion. Too many investors continue to interpret signals from a deteriorating paper market as a reflection of the underlying asset. That is a critical mistake. The futures system is the foul-play casino house.
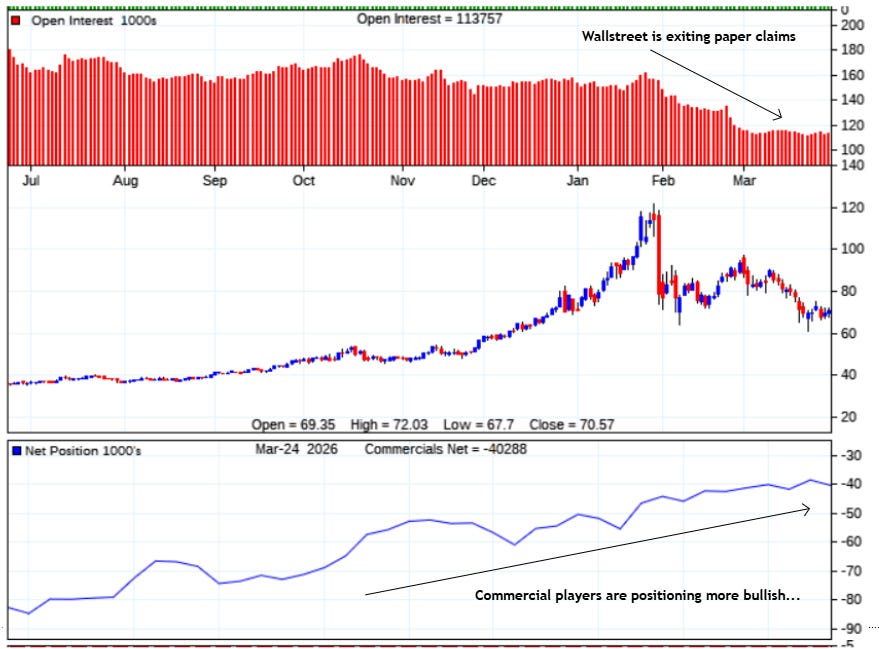
Wallstreet is exiting paper claims, while commercial players are positioning more bullish.
Liquidity issues
Indeed sound signals to be observed from gold and silver, and I am under no impression this is a structural top. Frankly, that is far off. This is merely a pause. You are living in the beginning of the paper system’s end, and not the other way around. This is not 1980. Not 2011. This “end” that has barely begun, will take 1-2 decades to resolve. Even so, I would emphasize that my primary focus in the short term remains on liquidity conditions. In that context, no asset is immune to dislocations in price behavior, regardless of its fundamental appeal. Liquidity stress does not discriminate nor cherry pick, and while I assign a high probability to gold having already established a bottom, the recent intermediate peak represents an important signal for broader market liquidity dynamics, extending beyond precious metals.
What must be understood is that when a dominant force begins to distort price action, such as tightening liquidity, one must remain adaptable. Even the most favored assets can come under pressure in such an environment. Gold’s recent behavior illustrates this clearly. The metal has corrected approximately 27 percent from peak to trough, a magnitude comparable to episodes such as the 2008 financial crisis. This selling of gold that began end of January 2026, took place simultaneously as we observed selling in most assets, with the exception of oil. Did you notice?
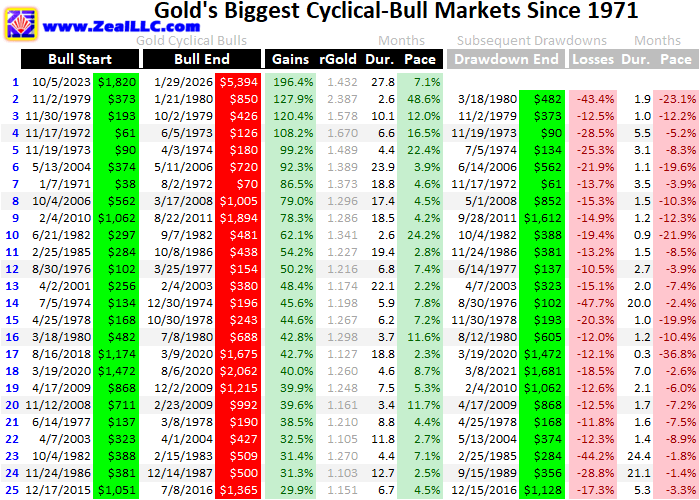
Looking at historical context, across more than 25 bull market (small and big) advances over the past 50 years, the median drawdown has been 15.3 percent and the average 20.8 percent. During the COVID period, gold experienced drawdowns of 18.5 percent and 12.1 percent. By comparison, the current correction of 27% is not only significant but exceeds typical historical norms, suggesting that gold has already undergone a classic and substantial retracement. A bear market that lasted less than 10,000 seconds (humor intended). From a statistical and technical standpoint, this is very good news for PM investors, particularly relative to those who take interest in the shorter run-way. In addition to undergoing a healthy correction, which almost felt like a flash-crash at first, gold has done so at a major Fibonacci extension level, further supporting the technical vicinity and reaction.
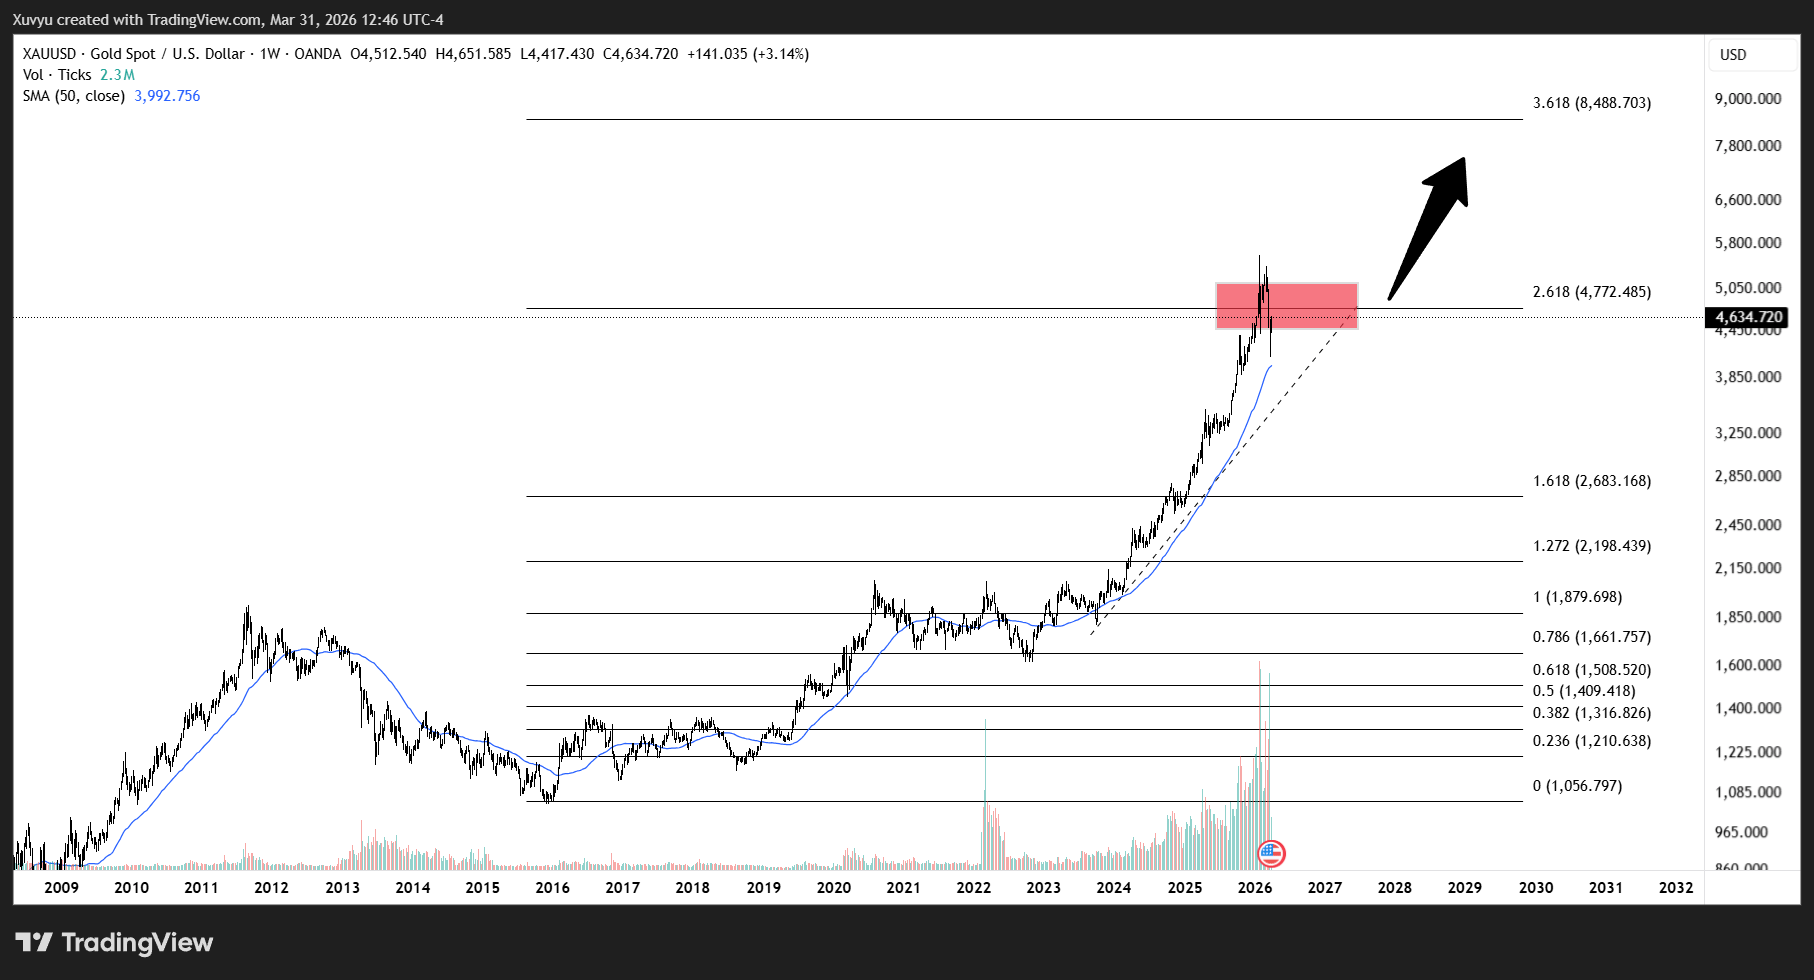
This represents an ideal level for gold to consolidate, particularly as broader market stresses begin to emerge, before potentially advancing toward the next target near $8,500.
I must say, it is remarkable how gold has already corrected to a level equivalent to the 2008 bust. That is crash-level territory, all said and done before we could even blink. Hmm.. As investors were spooked, it also served as an opportunity to cover thousands of tonnes of silver short, no doubt dismissed as coincidence. Yes they actually did this. It wasn’t a topping event where the typical massive shorts were placed, but the other way around, where massive shorts were covered in to and post wipe. With only 8 traders on COMEX accounting for (buying back/covering) approximately 2,300 tonnes silver since wipe January 30th.
The last minute rescue.
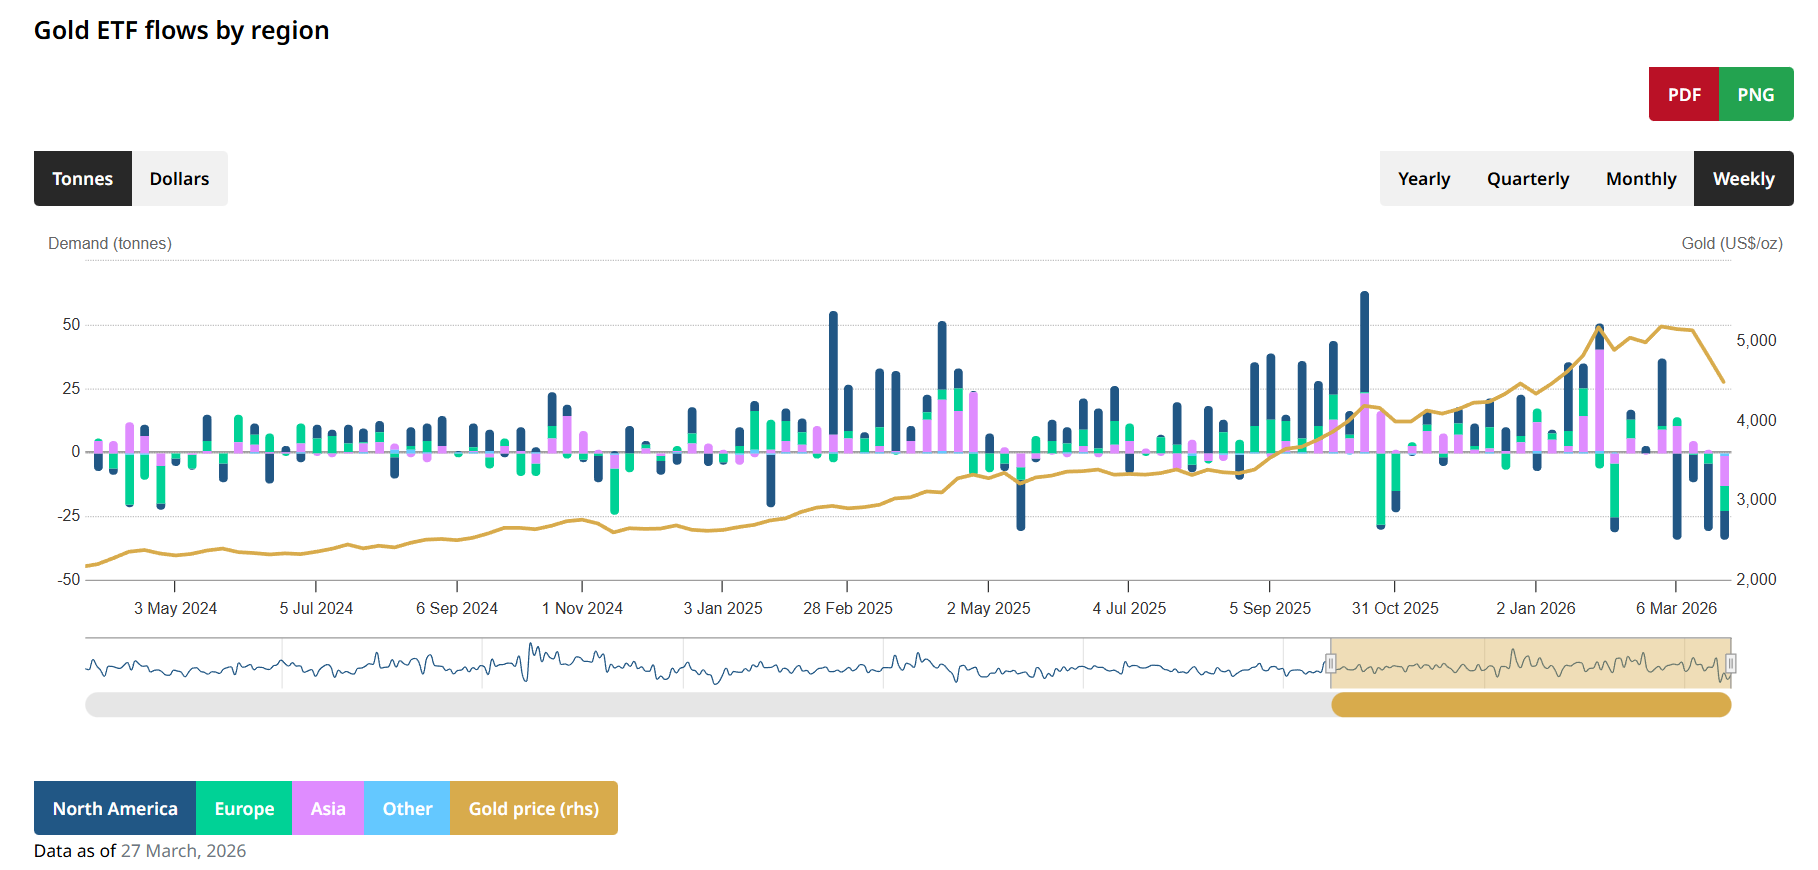
The key takeaway is not simply the magnitude of the correction, but what this intermediate pause in gold is signaling for broader markets. Even if gold has already established a bottom, and may now attempt to reclaim prior highs, the overall backdrop appears increasingly fragile. We are now observing renewed equity selling, notable selling-pressure in bond markets, and four consecutive weeks of net outflows from gold ETFs.
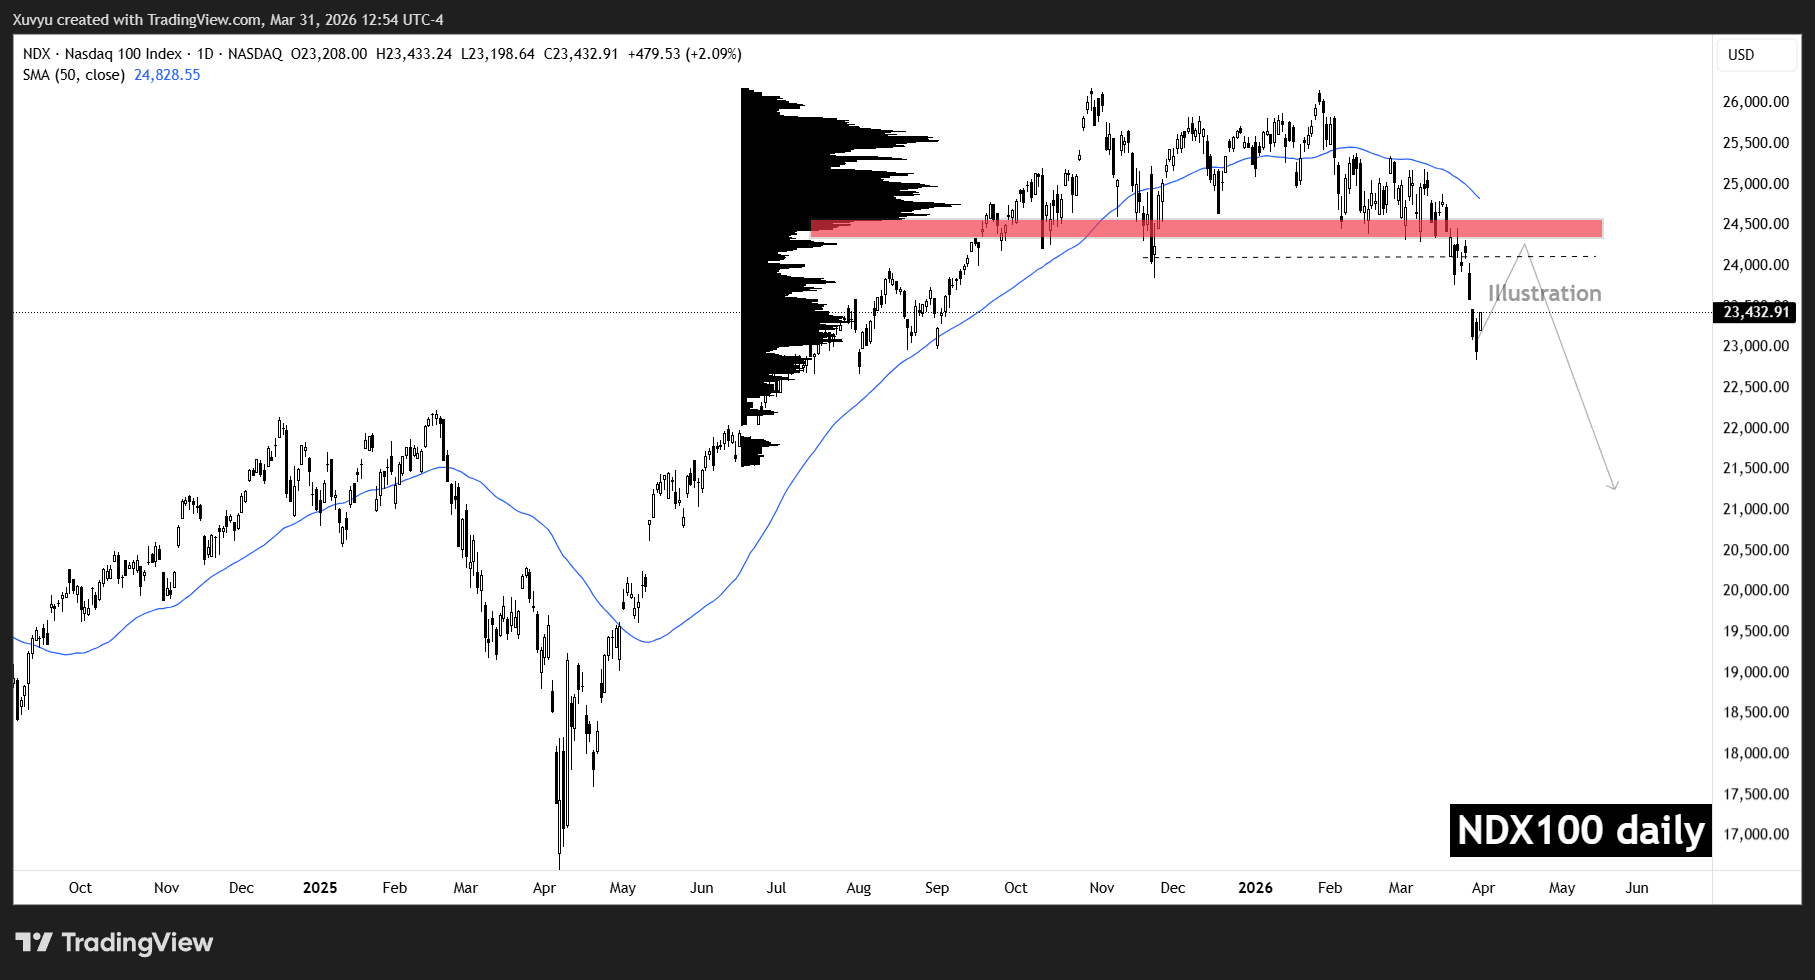
The NASDAQ 100 index is now beginning to breach key liquidity and distribution structures, a development that should not come as a surprise given the shifting incentives for foreign capital to remain allocated to U.S. dollar-denominated assets. While the chart tell us that the structures are breaking, I have been pressing on the potential structural trigger for it, which is the ramp up of foreign capital exiting.
At the same time, conditions in the bond market remain far from constructive. Price action is clearly signaling underlying stress, reinforcing that financial conditions are tightening, not stabilizing. While short-term moves have been aggressive, the focus should be on the broader five-year structure, which highlights a prolonged period of consolidation now coming to an end.
Yields have been consolidating since 2023/2024, and that range is now decisively breaking to the upside into late 2025 and early 2026. This can be viewed as a continuation of a broader behavioral shift among investors that has been developing over the past several years, characterized by capital & mindset gradually moving away from paper assets. This is a paradigm shift, and it has been a long process in the making. Yields are now at a critical inflection point, with the path forward clearly skewed to the upside. The next move in yields is unlikely to be gradual, but rather a sharp and accelerated repricing, supported by creditors demanding a harshly, but well deserved higher risk premium on sovereign government-bonds finding them selves in a debt-trap. Considered this type of long consolidations typically resolves in abrupt and swift momentum at its conclusion, doesn’t really paint that much of a better picture either.
Welcome to stagflation.
Are European households prepared for the combination of aggressive purchasing power erosion and sharply rising yields?
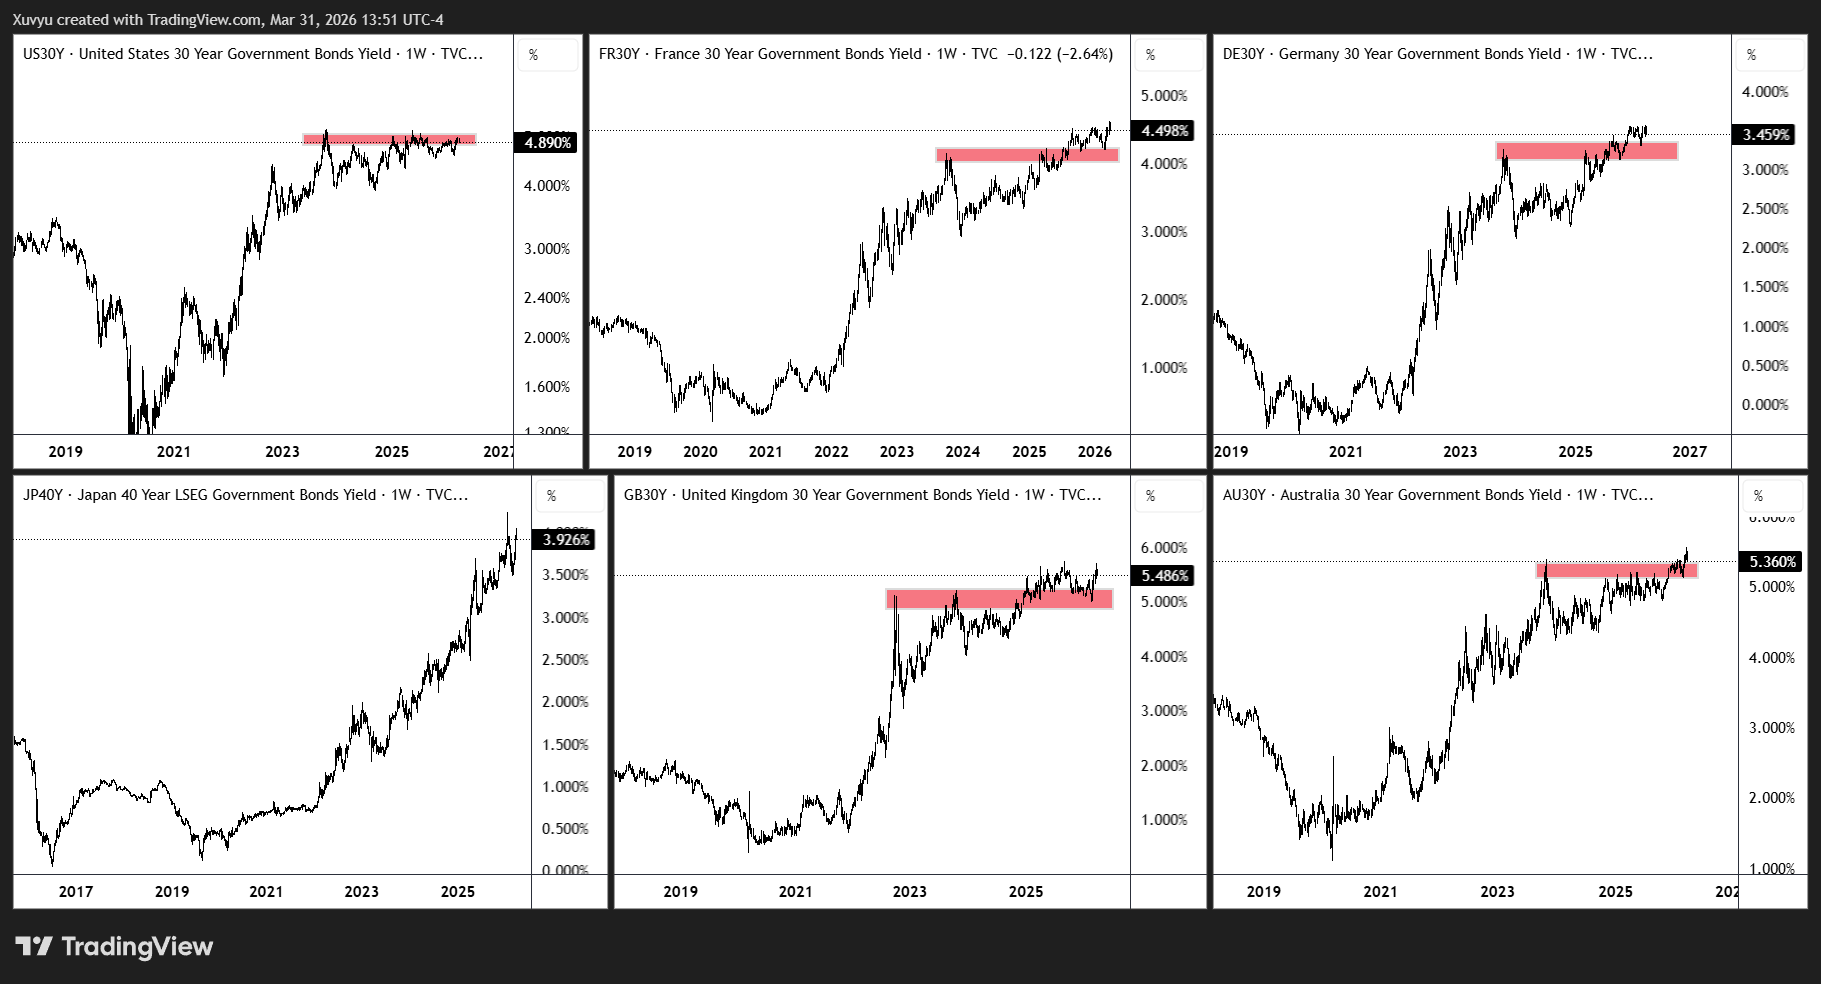
It is the same story across all of them. As established by these charts, what is the common condition among these six nations? You guessed it, they are increasingly finding themselves caught in a deteriorating debt trap, with Japan as the clear early mover.
To illustrate “liquidity issues”, so you can obtain a visual of the dynamic, we can reference the Bank of America High Yield Spread Index and overlay it with the price of silver. The key point to understand is that when high yield spreads widen or spike, it typically reflects emerging stress in market liquidity conditions, which impacts selling and buying of assets. While this relationship is not exclusive to silver, overlaying the two series helps highlight how silver tends to behave during both minor and more significant episodes of liquidity stress.
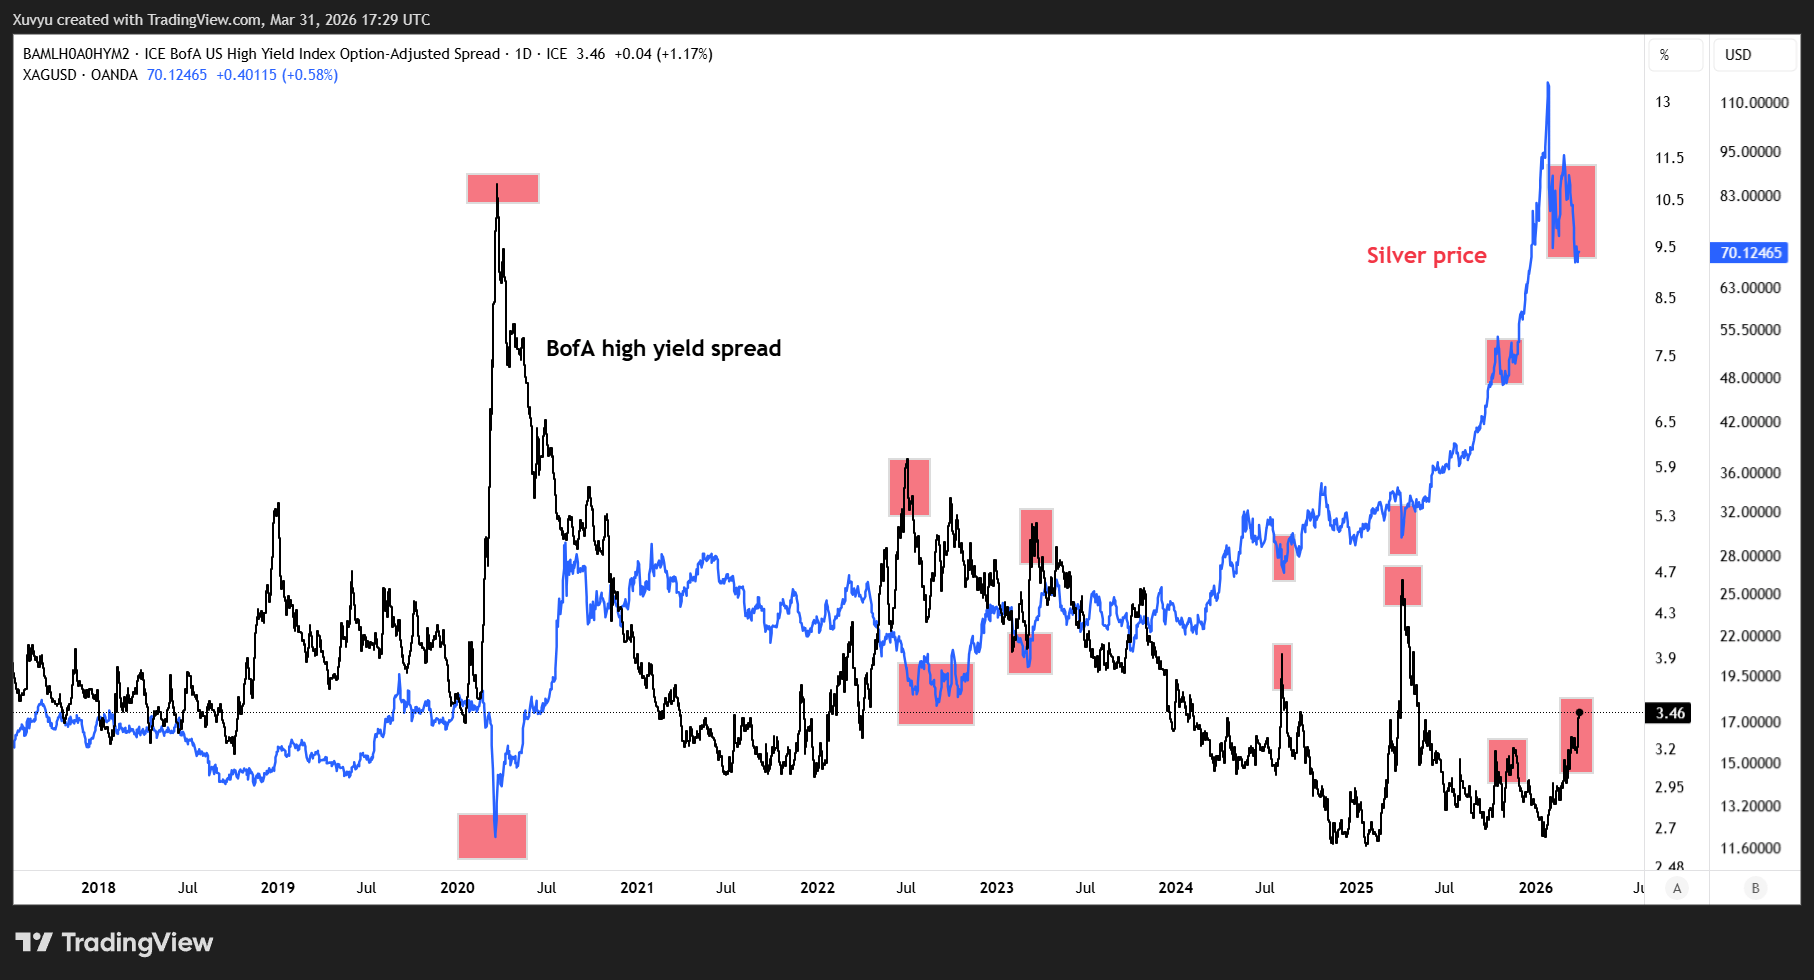
The objective here is not to focus on silver in isolation, nor the highyield spread, but to highlight one of the most important principles in asset investing. Capital flows and liquidity dynamics have the ability to dominate price action. More accurately, they will dominate price action, both to the upside and downside, eventually. Regardless of whether one is investing in gold, oil, or growth equities, a lack of awareness of these forces can lead to a misinterpretation of what is truly bullish or bearish. Price movements driven by liquidity can easily be mistaken for fundamental strength or weakness. BofA highyield overlayed with silver is only used as proxy here. Liquidity issues can still be masked despite not being evident in a proxy such as highyield spreads.
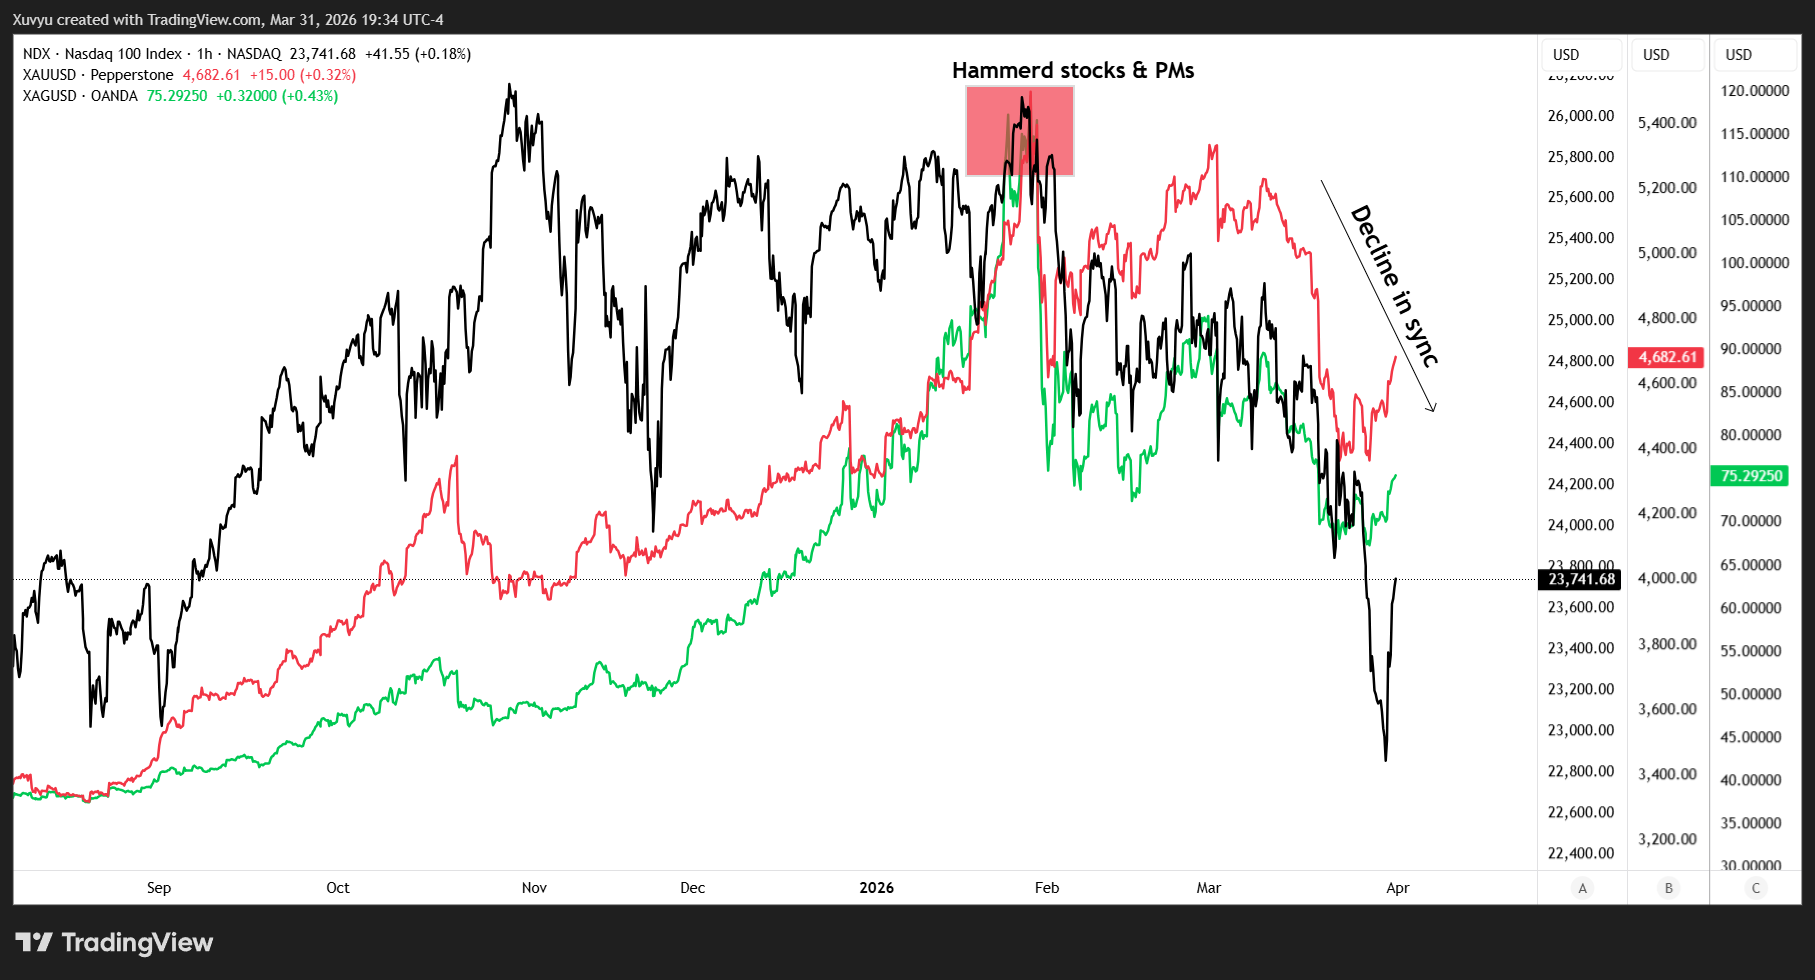
To illustrate even better how separated assets can get impacted by systemic selling, let us examine how gold, silver, and the NASDAQ 100 have evolved since the start of the year. As highlighted in the chart, all three were sold off simultaneously toward the end of January, marking the point where equities began to roll over. Gold slightly climbed back up while equities zig-zagged sideways. Fast forward two months to the end of March, and we observe a clear confluence of downward momentum impacting all three. This is not isolated weakness, but rather broad-based selling driven by liquidity issues or systemic selling. Starting to see what I am getting at?
More notably, since the start of October, the Federal Reserve has purchased securities totaling approximately $441.5 billion. That is nearly half a trillion dollars deployed into repo markets through the repurchase of securities and debt (!)
So mr. Fed, what the hell is cooking?
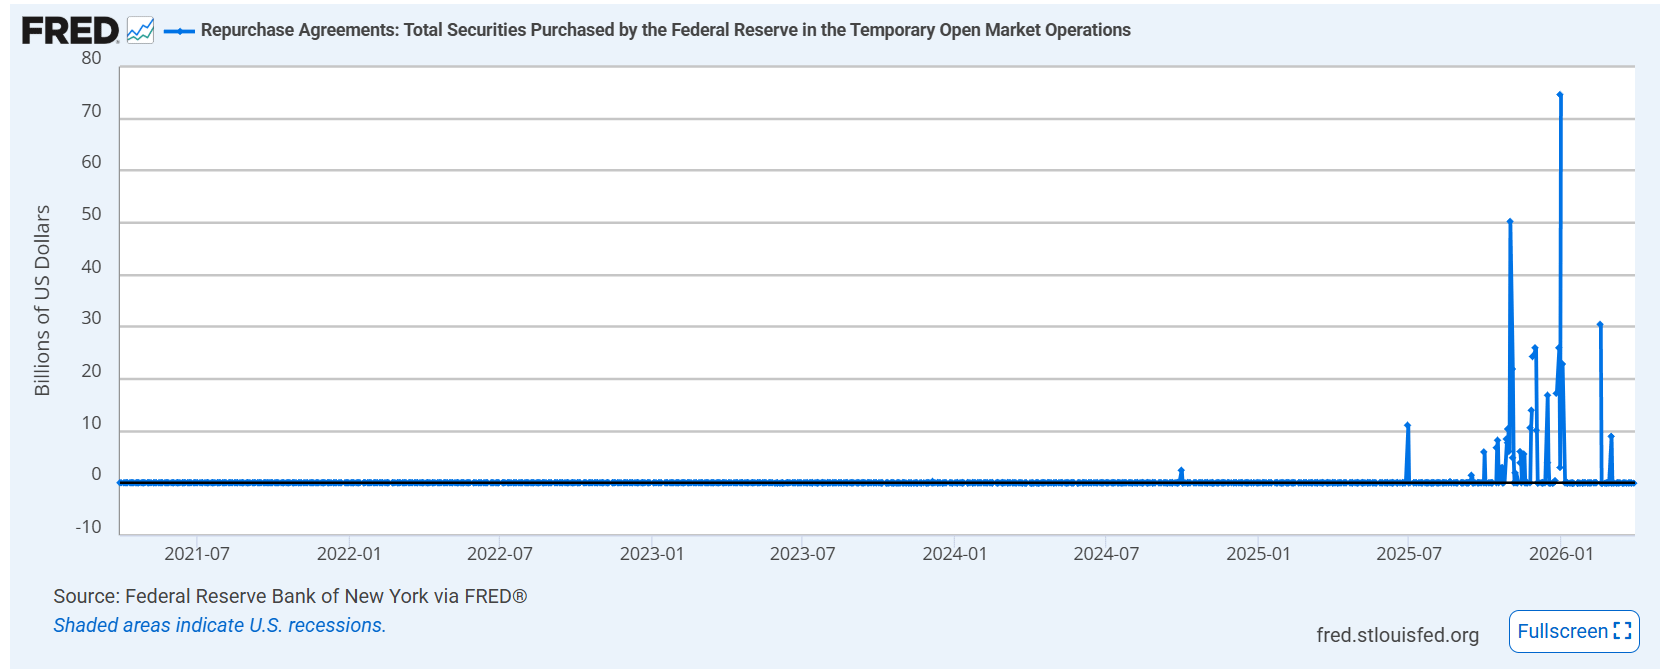
Indeed, regardless of prevailing fundamentals, narratives, or biases, the liquidity issues today are very real. If this is the moment where yields propel into their next leg higher, then equity markets are likely to face significant pressure. That, in turn, creates opportunity on our side in commodities. Flexibility is therefore essential. As liquidity stress evolves into more systemic and forced selling across key parts of the market to raise funds, even fundamentally strong assets can, and most likely will, be caught in the crossfire.
However, in such a scenario, where traditionally favored bonds are no longer a reliable refuge, it is important to recognize that gold is likely to become the primary destination for capital. (It already is the primary destination for smart money, I give it five to seven years before it turns semi-consensus)
In retrospect, current developments reinforce the view that liquidity conditions were about to tighten across the system, and the short positions seem to have been established at a sound timing. I’m aware some readers found it spooky at first, and that is fine. Furthermore, in such an environment with liquidity problems, market participants are often forced to sell assets they would otherwise prefer to hold. Next are speculators experiencing margin calls. This brings me back to a point I made two-three weeks ago: “I suspect investors may have to sell what they do not want to sell.” In other words, a growing number of participants may be forced to liquidate positions not out of choice, but out of necessity. This places me in a flexible position, open to a wide range of outcomes, as I greatly respect the power of capital flows. In the financial jungle, liquidity and capital flows are like Gods. You must respect it.
So, when in doubt, particularly with silver, look to gold. Gold has corrected equvivalent to the 2008 bust, and this appears to be an ideal vicinity for gold to consolidate. Gold has likely already reflected the liquidity stress, and may even be offering an early warning for what could unfold across broader credit and equity markets. My core message to you is capital flows are a force that must be respected. They have the power to dominate price action and can easily distort how an asset is perceived. Without a proper understanding of these dynamics, investors risk misinterpreting what is truly driving assets or markets. With the proper understanding, and you will make better investment decisions. Something to exploit as well, because ultimately, its just mechanical inputs. If mechanical inputs forces fundamentally good assets cheaper, that is what we call an “opportunity”. Even better when mechanical inputs are mixed with emotional fear. Then you are looking at super opportunities.
No reason to feel edgy. May it prove to be overly cautious, but this is a vital part of the capital-rotation regardless. We are standing at an inflection point, just before the lights are turned off for the paper system in full. Embrace it. I am in the boat with you, and right now your companion is smiling so much his teeth might fall out. Do you realize how long I have been waiting for this, the paper system, gold, the bonds, the conflicts -mapping out this very path, and the thousands of hours behind it? No words can explain.
Buckle up.
Best regards
Corporalis Commodis, Lasse
Thank you, Lasse! God Påske😁