


This is not financial advice, and you should always do your own due diligence.
Errors may occur.
CC Discord Server only for paid readers.
Content; 1,379 words 8,871 character, 21 Minute Recording, 16 Charts, Macro Commentary, Macro, Commodities, DowJones/USOIL Ratio, Breakouts, GDP & Debt, Inflationary waves, CPI & PPI, Consumer Prices Lags Producer Prices & Raw Commodity Visualized, 5 Minute Pure-Commentary End Of Recording, Historical Oil & Gas vs Tech CAPEX.
The relationship between producer prices for raw commodities and consumer prices will be analyzed in detail below, using Norwegian retail coffee shops as a case study as Coffee prices is rocketing once again. Specifically, I have systematically tracked the price of a latte at Espresso House over several years and compared this data against the timeline of raw coffee futures. This comparison effectively illustrates the typical lag between fluctuations in producer costs / raw commodity and their eventual lag-impact on consumer prices, so you can understand the economical mechanism better.
See Technical Mayhem — 2025 Kickoff Vol. 1 for more context, as this letter is a quick follow up.
2025 Kickoff - Vol 1 (CLICK)
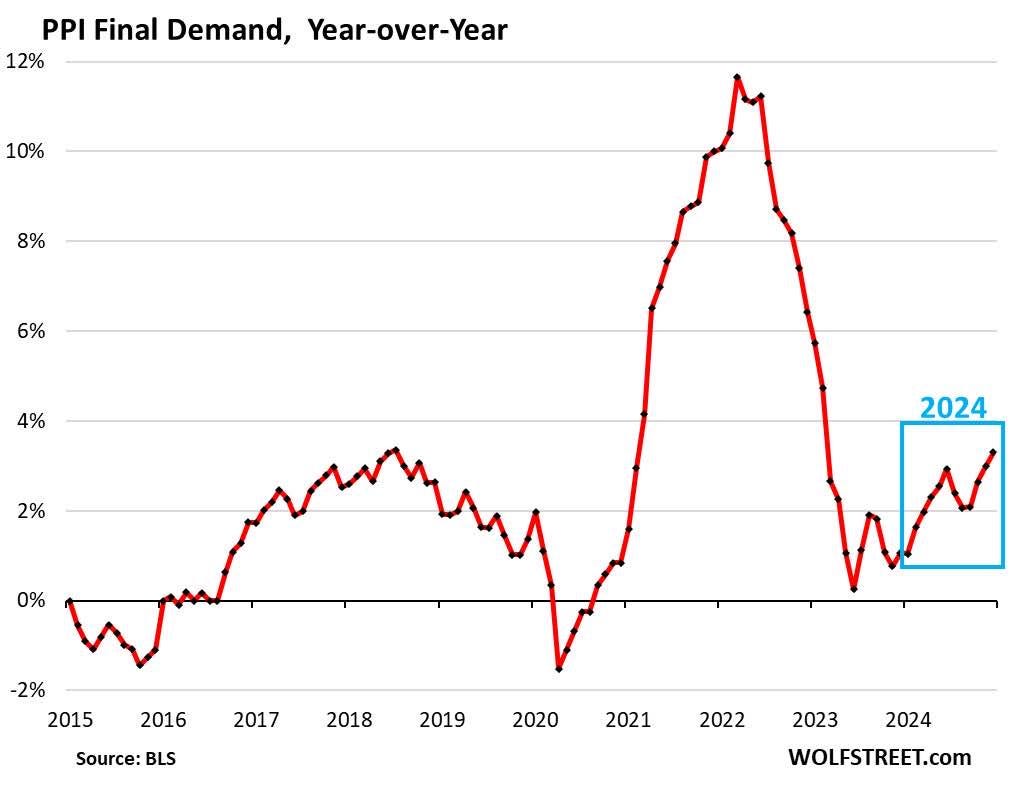
Producer Prices — Gaining Momentum
Producer Price Index YOY
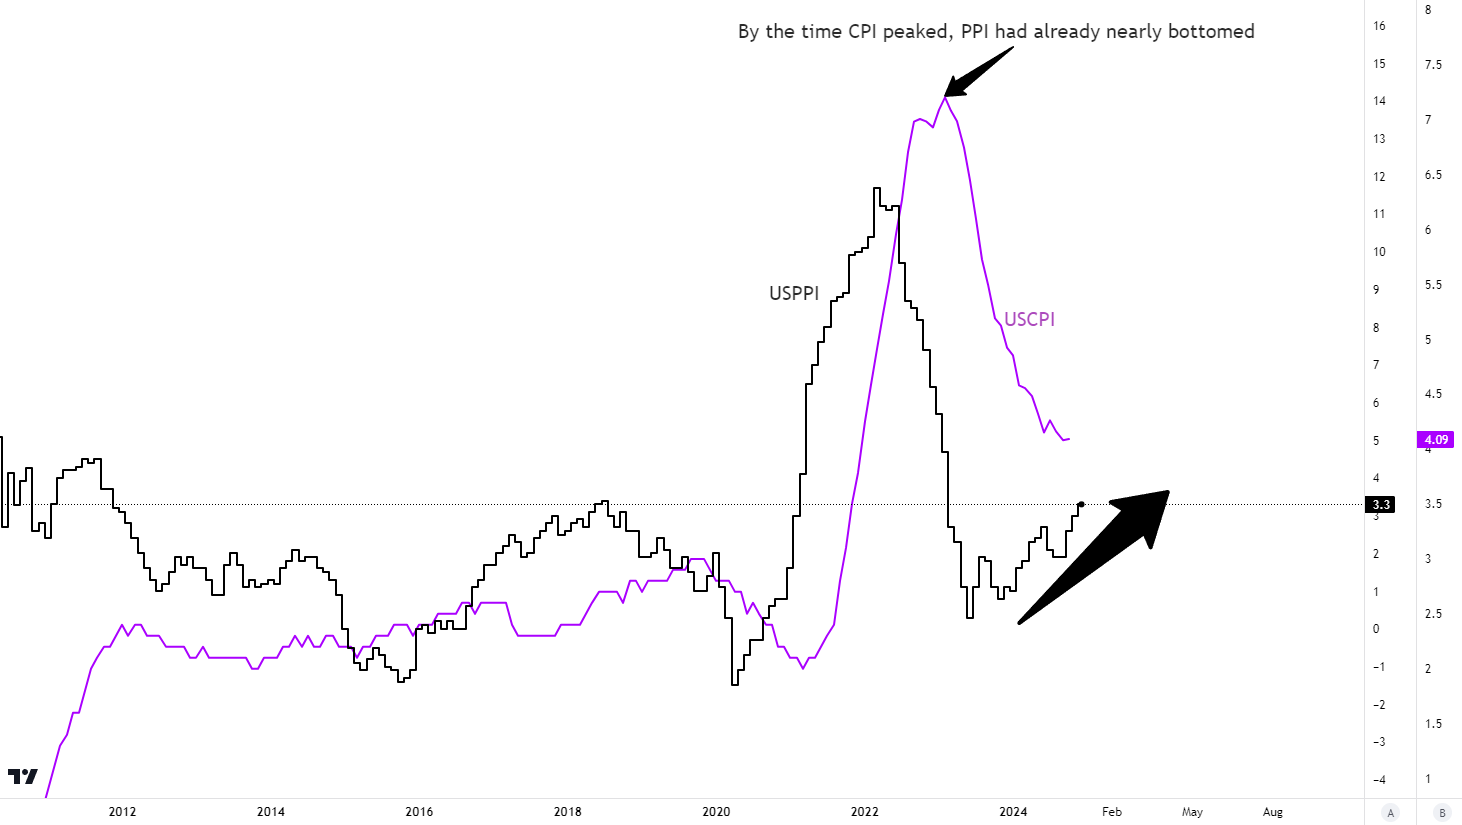
Producer Price Index YOY, Consumer Price Index YOY — overlayed
Producer Price Index — New Trend Has Emerged
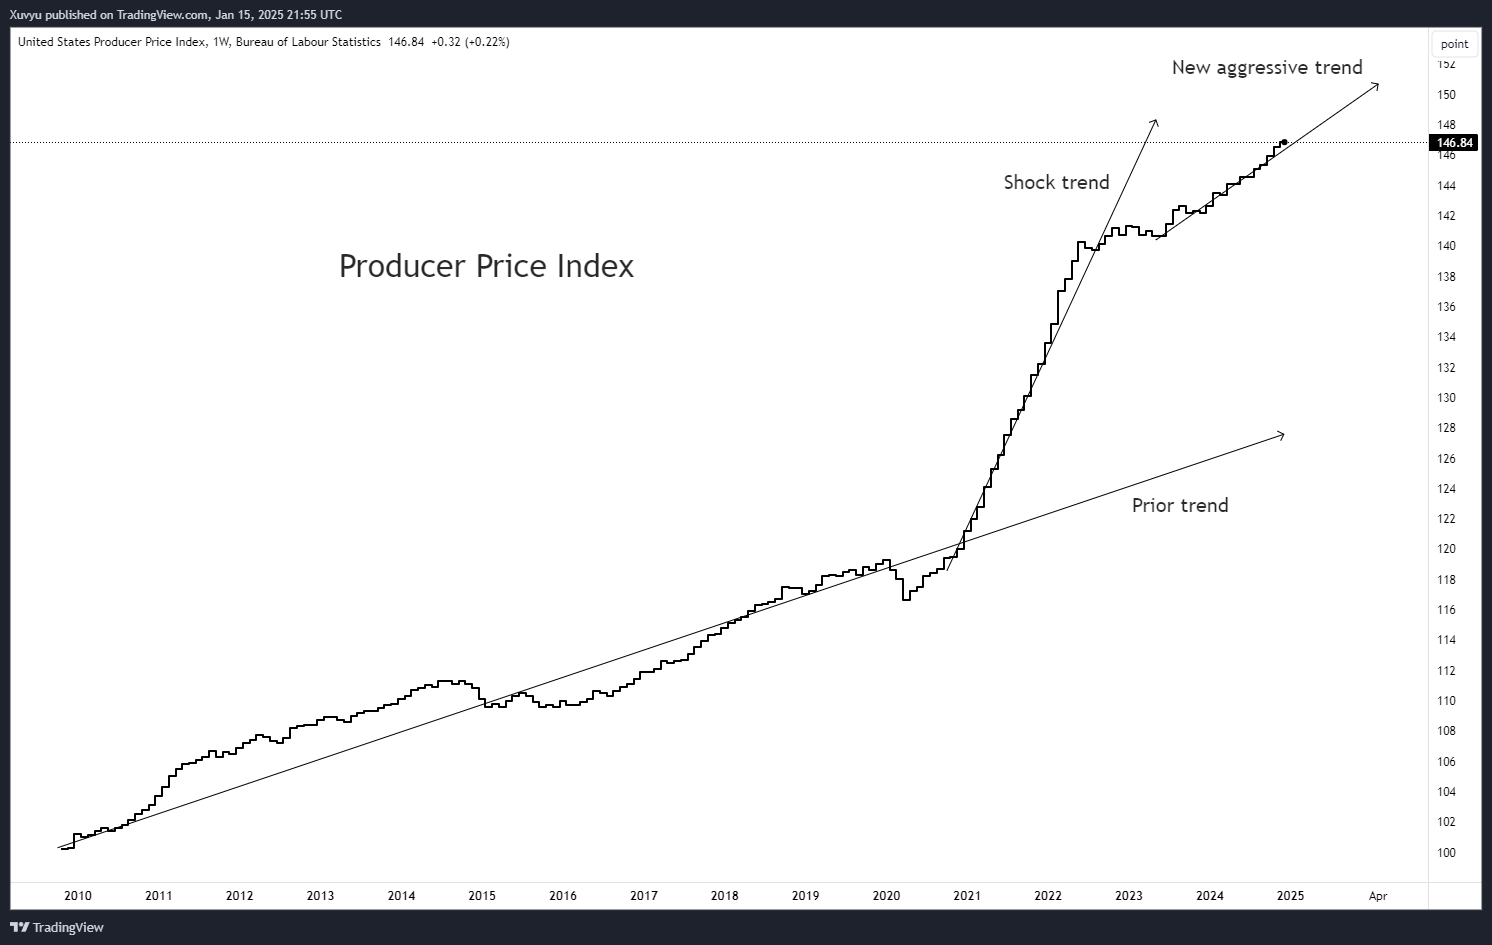
While CNN Highlights Positive CPI Data, Corporalis Commodis Identifies The Opposite — Emerging Inflationary Pressures. Just the trough of a wave, nothing more, nothing less.
While mainstream media outlets like CNN report that inflation is under control—highlighting a favorable Consumer Price Index (CPI) print—the underlying economic reality tells a different story. The Producer Price Index (PPI), often regarded as a leading indicator of inflationary pressures, bottomed 1.5 years ago and is now gaining momentum. Historically, the PPI leads the CPI by approximately 6 to 18 months, a trend I have emphasized over the past five years, particularly during the early stages of the previous inflationary wave between Q4 2020 and Q1 2021. Notably, the PPI has recently recorded its highest figure in two years, coinciding with a period when CPI data appears to show subdued inflation. This divergence warrants closer examination.
Our quick scope of macroeconomics in this recording takes into account a range of critical indicators, including the resurgence of Money Supply (M2), alongside traditional metrics such as CPI, PPI, national debt levels, and GDP. Furthermore, the sharp breakout in the Thomson Reuters Core Commodity Index signals a broader shift in commodity markets, which contains 19 commodities. This is complemented by movements in key assets such as Crude Oil, Dow Jones Industrial Average To Oil Ratio (Inverted scale), including copper and the S&P 500 Energy sector. These macroeconomic signals collectively suggest that commodity markets are diverging from the prevailing narrative of a disinflationary environment, challenging the optimistic expectations held by the world as a collective herd mentality.
It is crucial to recognize that the general public often misunderstands the fundamental drivers of inflation, not to mention economical commentators in mainstream media, and the incompetence (or lies?) from politicians. A common misconception is that rising commodity prices directly cause inflation. In reality, commodities serve as an economic input rather than the root cause of inflation. True inflation emerges when the growth rate of money supply and debt in circulation outpaces the production of goods and services. This imbalance between monetary expansion and productive capacity ultimately manifests as inflationary pressure in the economy.
As we evaluate these macroeconomic dynamics, it becomes evident that inflationary forces may be far from subdued. As highlighted before the first inflationary wave, this will come in waves. The waves will put the herd off traction. The peak of the wave, inflation is ever-lasting. The trough of the wave, inflation is eliminated. This is psychology tagging along with price and developments. Herd mentality = lag. A comprehensive understanding of these complex interactions is essential for accurately assessing the economic landscape and making informed decisions.
Producer Price Dynamics Leading Consumer Price Increases — With A Lagtime
Coffee Futures vs Espresso House Norway Latte Prices
Coffee serves as a perfect example of how producer prices influence consumer costs. And let's be honest—we Norwegians do love our coffee, don’t we? As recently highlighted in the Corporalis Commodis Discord Server, Arabica futures have surged dramatically in recent months. It’s critical to understand the relationship between producer/raw commodity and consumer prices. Historically, producer prices move first, with consumer prices following due to inherent lag effects across supply chains, manufacturing, and retail operations.
A clear demonstration of this dynamic is unfolding in Norway’s retail coffee sector, where approximately 95% of the coffee consumed is Arabica—a commodity that has been subject to substantial price volatility. This pattern illustrates how price shocks in global commodities markets gradually filter down to the consumer level, often with a delay of 6 months to 2 years.
Tracking the Price of a Latte at Espresso House (Norway)
To better illustrate this lag between producer costs and consumer prices, I have been closely monitoring the price of a standard latte at Espresso House in Norway, one of Norway's most popular retail coffee chains, over recent years:
H1 2022: 38 NOK
H2 2022: 46 NOK — +21%
H1 2023: 54 NOK — +17%
H2 2023: 62 NOK — +15%
2024: 68 NOK — +10%
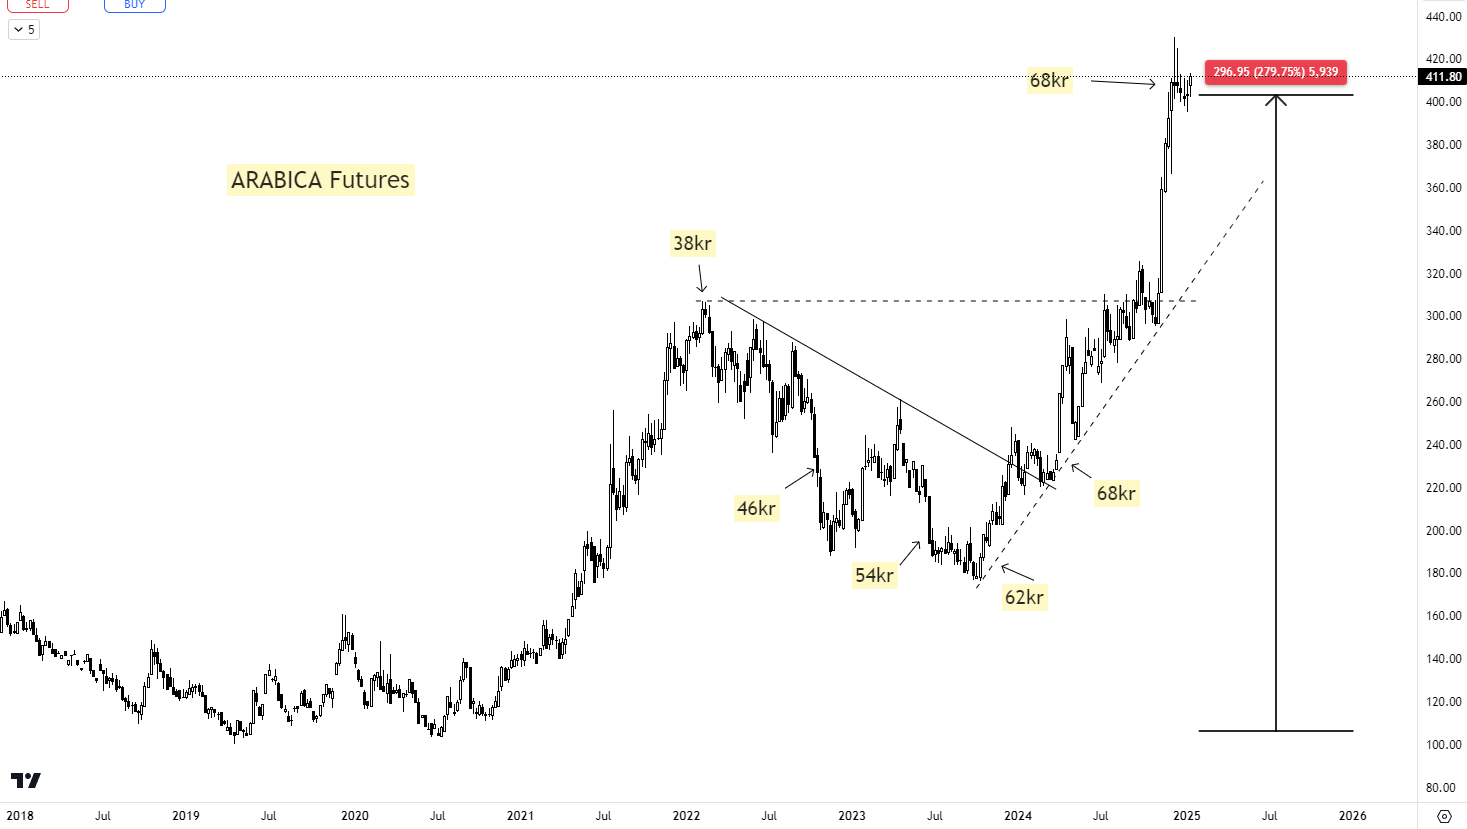
This steady price increase reflects the delayed impact of raw material costs on consumer products. Arabica coffee futures peaked in January 2022 after a staggering 200% surge, only to correct by -43% in the months that followed. This significant correction in Arabica futures temporarily alleviated some pressure on retail coffee prices. However, the gradual rise in latte prices from 2022 to 2024 illustrates the typical 12–24 month lag between raw commodity price changes and consumer retail pricing—especially evident in this case, Norway's coffee retail market.
Renewed Surge in Arabica Prices
After bottoming out in Q4 2023, Arabica prices began a modest but aggressive recovery throughout 2024. However, by Q4 2024, this recovery turned into a sharp surge. In November 2024, Arabica futures shattered their previous 2022 peak of $305 per 60kg, climbing an additional 33% to reach $412 per 60kg in the moment of writing this letter. This rapid resurgence in raw coffee prices is alarming and raises immediate concerns about how soon these producer costs will translate into higher consumer prices for everyday products like coffee consumers.
Moreover, this upward momentum in Arabica prices could tighten profit margins for retailers, forcing them to pass these rapid costs onto consumers. Coffee shop chains, especially in premium markets like Norway, are unlikely to absorb these higher input costs indefinitely. As always, it will be pushed on to the consumers. Consumers should prepare for even higher retail prices.
Future Consumer Impact and Market Outlook
Given the historical lag between producer and consumer price adjustments, it seems increasingly likely that the cost of a latte at Espresso House could soon surpass 100 NOK. For students and frequent coffee shop patrons, this trend could mean spending nearly 1,000 NOK monthly on just 10 cups of coffee. A couple of years back, 10 cups costed you 300kr. This possibility raises a critical question:
When will a latte at Oslo’s Espresso House cross the 100 NOK threshold? However, the continued and aggressive rise in Arabica prices suggests that this milestone may arrive sooner rather than later.
And let’s not forget about Robusta coffee—its price dynamics are following a similar trend, if not worse. Historically viewed as a more affordable and resilient alternative to Arabica, even Robusta is now experiencing significant price pressures, leaving little room for price relief across the global coffee market.
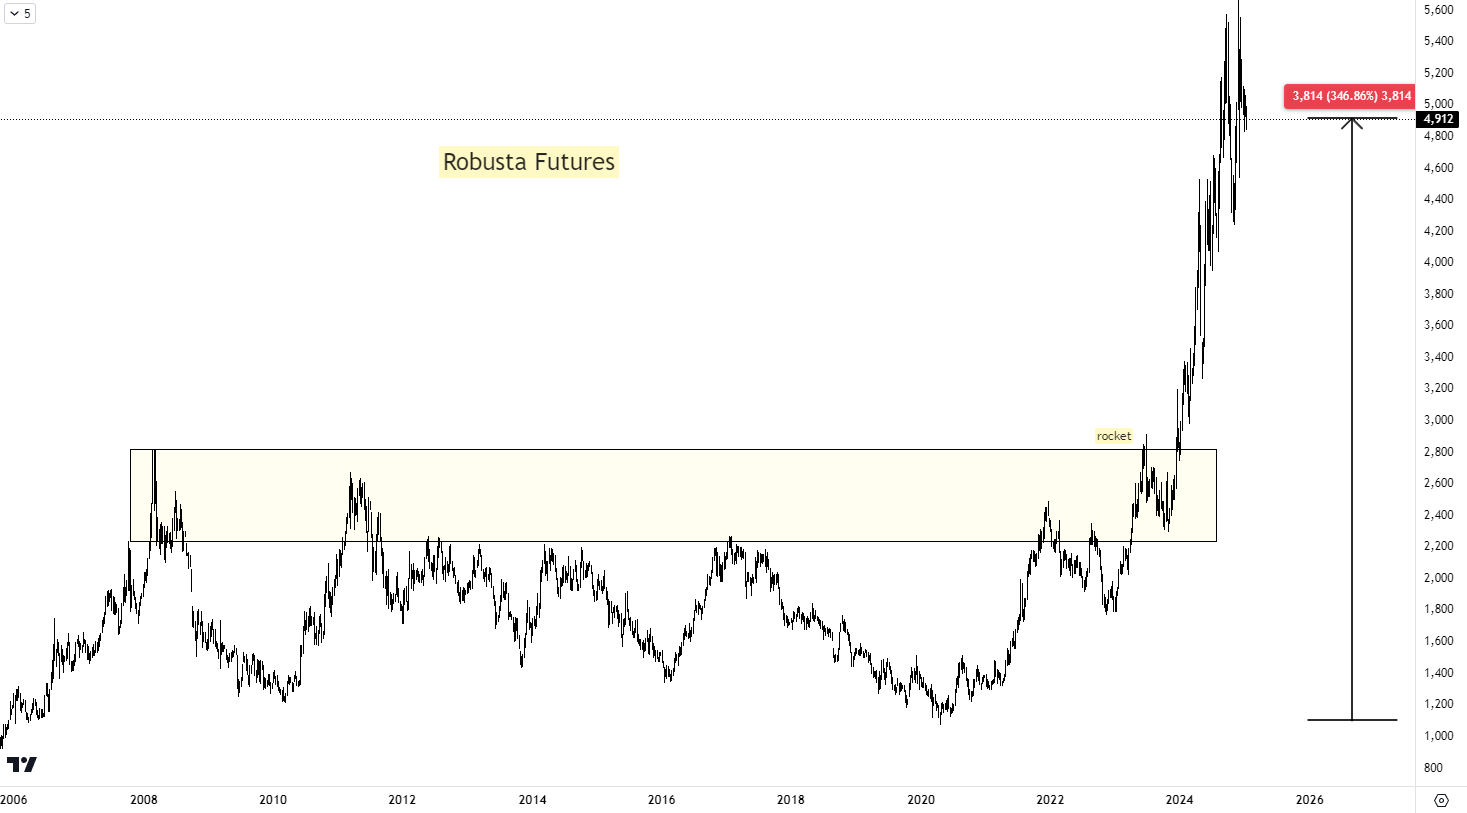
Like stated above, Robusta Coffee is historically viewed as a more affordable option, but despite Robusta is also aggressively tickin up, the precentage difference is shrinking. This chart is standing at $4,912 per 1000kg. Let us convert it;
Formula to convert USD per metric ton (1000kg) to USD per 60kg:
60 / 1000 = 0.06
Price per 60kg= Price per metric ton × 0.06
If the current price of Robusta Coffee Futures is 4,912 USD per metric ton:
4,912 × 0.06 = $294.72 per 60kg.
Getting closer to Arabicas $411 per 60kg. In percentages gap, the price difference for 60kg Arabica and Robusta was 54% in 2020, meaning Arabica was 54% more expensive. Today that gap has gradually been narrowed down to 39%. At this very moment, both is surging higher, meaning both of them is becoming less affordable but at the same time Robusta (The cheap) is slowly catching up to Arabica.
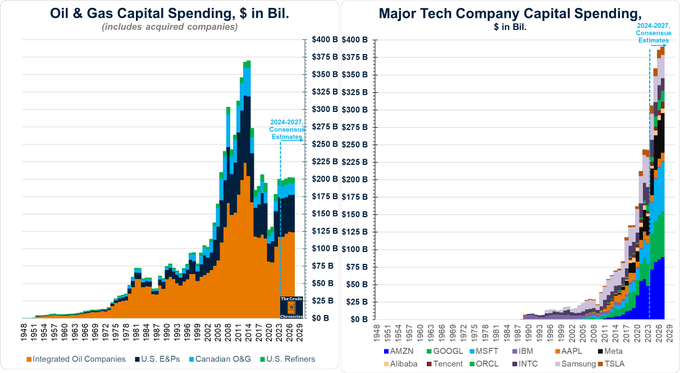
Final treat, more about the dis-allocation of capital at a later point;
På godt norsk; Lykke til?
Buckle up.
Best Regards
Corporalis Commodis
Listen to this episode with a 7-day free trial
Subscribe to Corporalis Commodis to listen to this post and get 7 days of free access to the full post archives.
